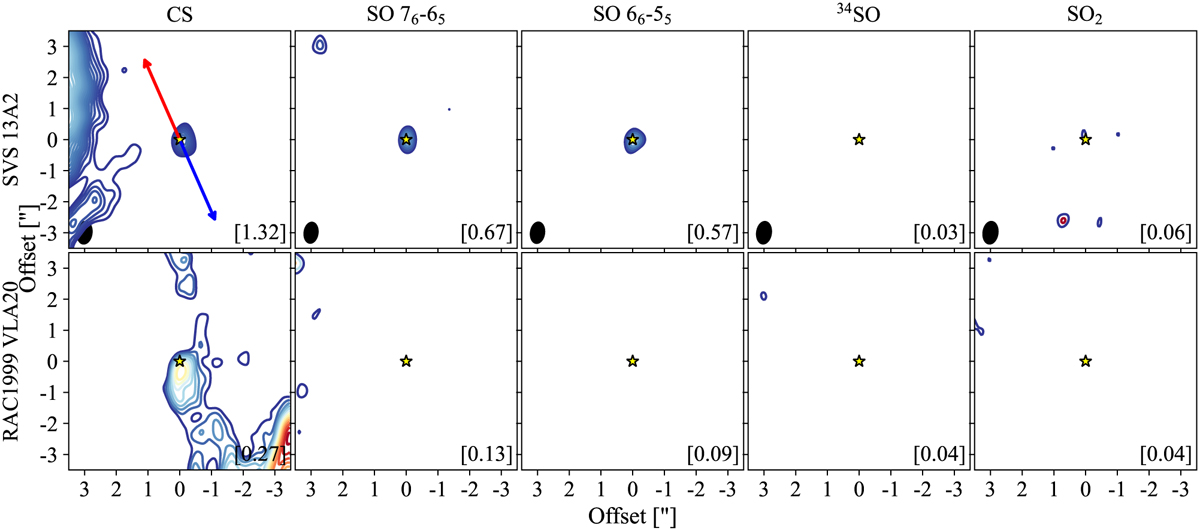
Fig. 3
Download original image
Sources with unknown TЬо1. Moment 0 maps of CS, SO, 34SO, and SO2. The contours start at 3σ, follow steps of 1σ, and the emission has been integrated over the velocity ranges listed in Table B.1. Maximum values (in units of Jy beairr−1 km s−1) are indicated in the bottom-right corner of each panel. Red and blue arrows represent the outflow direction and the yellow star indicates the position of the continuum peak. The synthesized beam for each molecular transition is shown in the panels of the first row. Sources with no detections are not shown in this figure.
Current usage metrics show cumulative count of Article Views (full-text article views including HTML views, PDF and ePub downloads, according to the available data) and Abstracts Views on Vision4Press platform.
Data correspond to usage on the plateform after 2015. The current usage metrics is available 48-96 hours after online publication and is updated daily on week days.
Initial download of the metrics may take a while.