Fig. E.2
Download original image
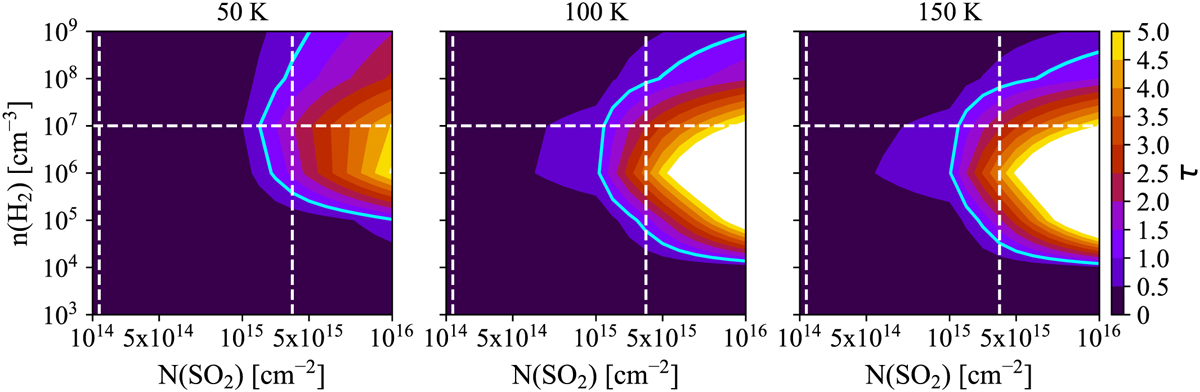
RADEX models. Optical depth of the SO2 140,14−131,13 transition for three different excitation temperatures: 50, 100, and 150 K. The cyan contour represents τ = 1, the two dashed white vertical lines indicate the range of values obtained for ![]() for most of the sources, and the dashed white horizontal line shows an H2 number density of 107 cm−3 (lower limit for nH used in the calculations).
for most of the sources, and the dashed white horizontal line shows an H2 number density of 107 cm−3 (lower limit for nH used in the calculations).
Current usage metrics show cumulative count of Article Views (full-text article views including HTML views, PDF and ePub downloads, according to the available data) and Abstracts Views on Vision4Press platform.
Data correspond to usage on the plateform after 2015. The current usage metrics is available 48-96 hours after online publication and is updated daily on week days.
Initial download of the metrics may take a while.