Fig. E.1
Download original image
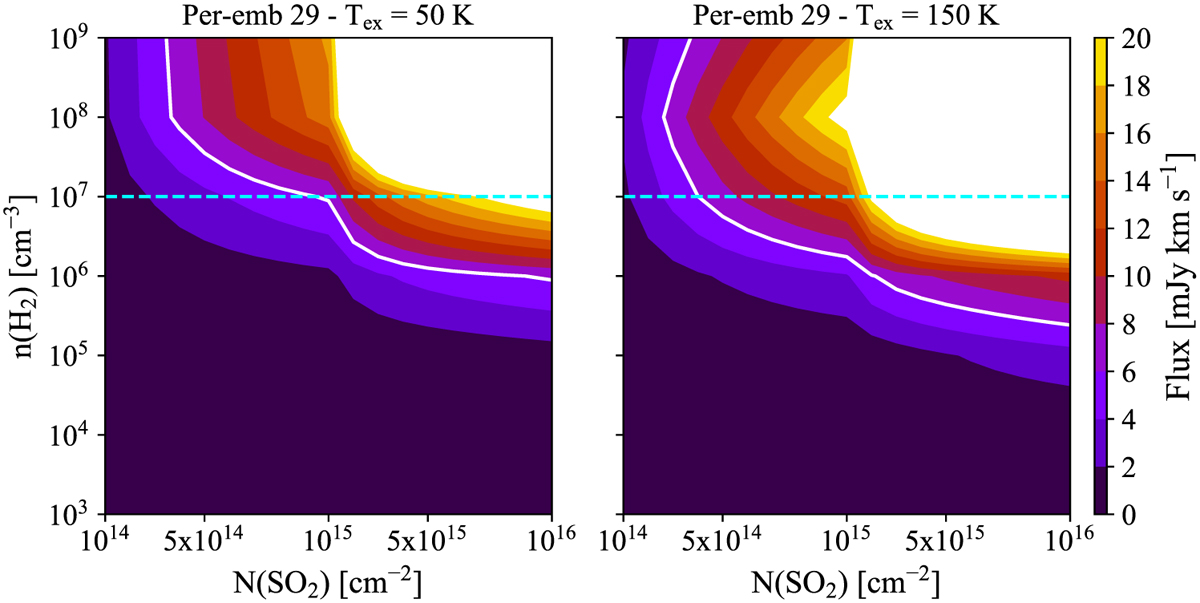
RADEX models for Per-emb 29. Fluxes of the SO2 140,14−131,13 transition for two different kinetic temperatures: 50 K (left) and 150 K (right). The white contour represents the flux observed for this source and the dashed cyan contour shows an H2 number density of 107 cm−3 (lower limit for nH used in the calculations). In this example, the ![]() present a minimum value of 3 × 1014 cm−2 (for Tex = 150) and a maximum value of 1 × 1015 cm−2 (for Tex = 50), in a range between 107 and 109 cm−3.
present a minimum value of 3 × 1014 cm−2 (for Tex = 150) and a maximum value of 1 × 1015 cm−2 (for Tex = 50), in a range between 107 and 109 cm−3.
Current usage metrics show cumulative count of Article Views (full-text article views including HTML views, PDF and ePub downloads, according to the available data) and Abstracts Views on Vision4Press platform.
Data correspond to usage on the plateform after 2015. The current usage metrics is available 48-96 hours after online publication and is updated daily on week days.
Initial download of the metrics may take a while.