Fig. D.1
Download original image
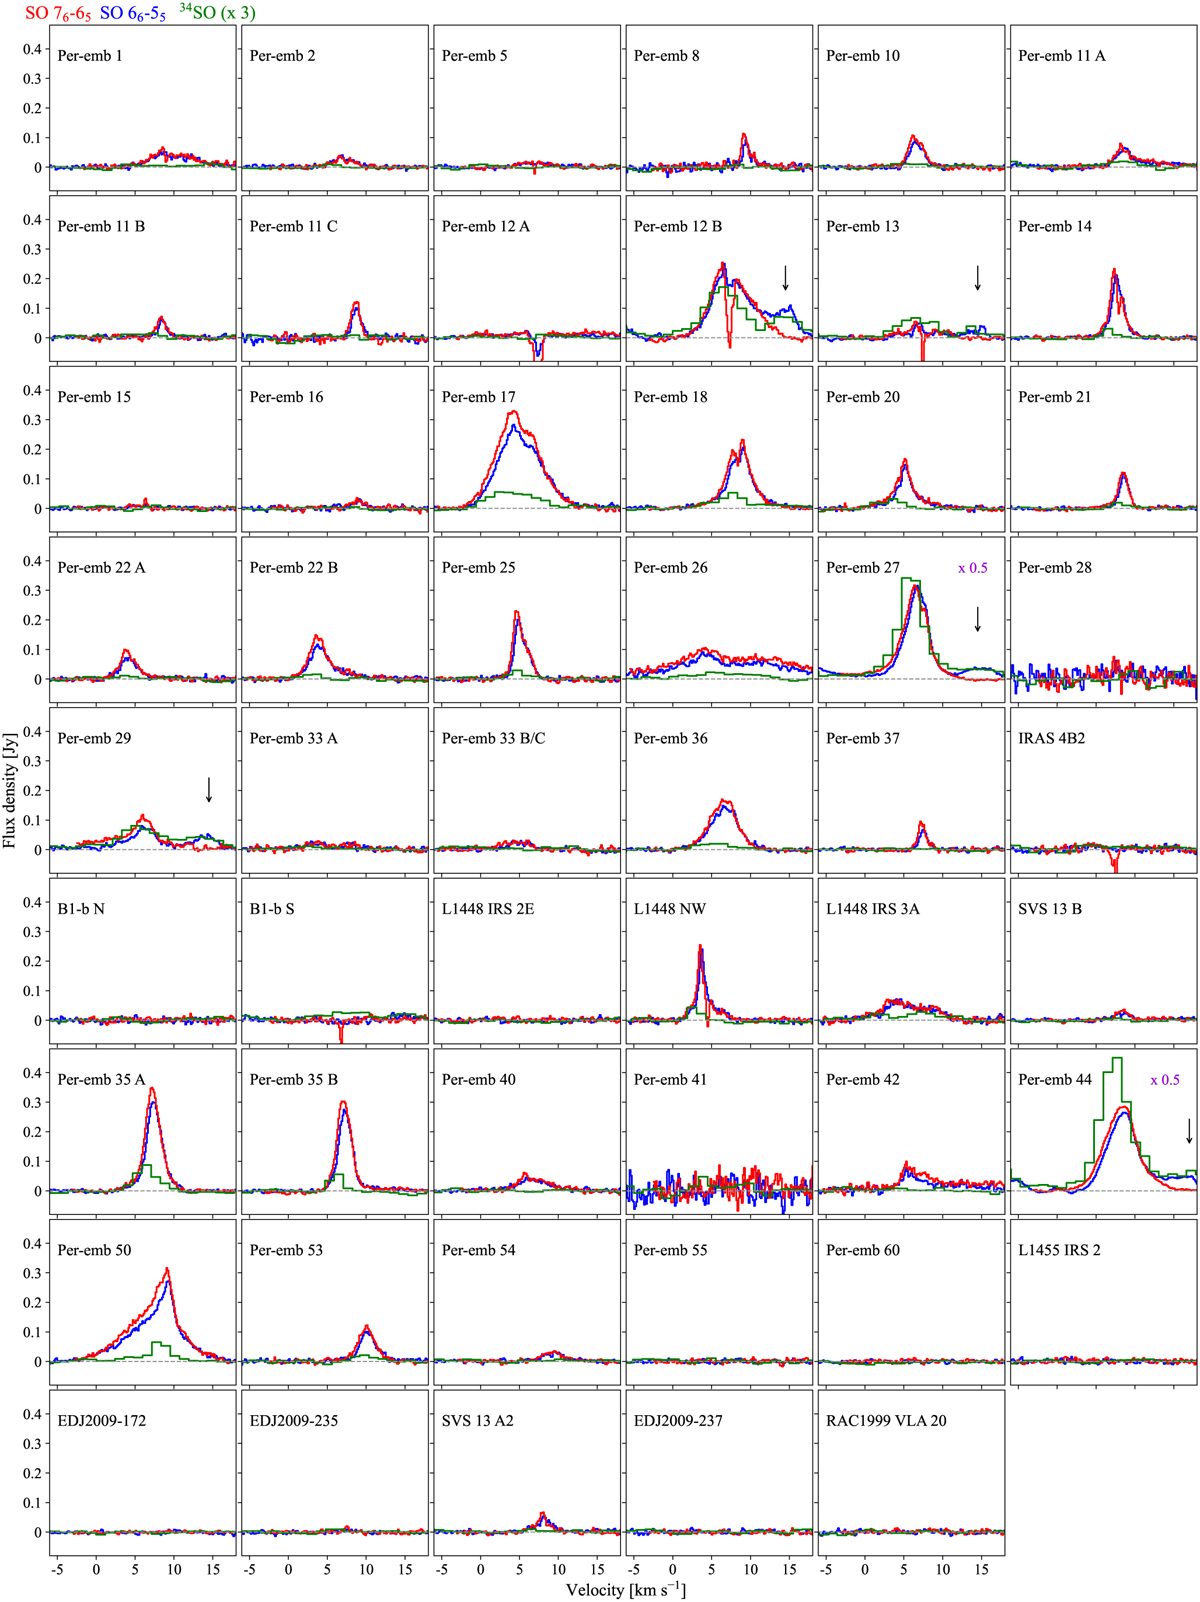
Integrated spectra of SO 76−65 (red), SO 66−55 (blue), and 34SO 56−45 (green). The integration area for each source is listed in Table B.1 and the 34SO 56−45 spectra have been multiplied by three, for a better comparison. Black arrows in the panels that correspond to Per-emb 12 B, Per-emb 13, Per-emb 27, Per-emb 29, and Per-emb 44 indicate an offset emission, likely related with a transition from an unidentified COM.
Current usage metrics show cumulative count of Article Views (full-text article views including HTML views, PDF and ePub downloads, according to the available data) and Abstracts Views on Vision4Press platform.
Data correspond to usage on the plateform after 2015. The current usage metrics is available 48-96 hours after online publication and is updated daily on week days.
Initial download of the metrics may take a while.