Fig. 12
Download original image
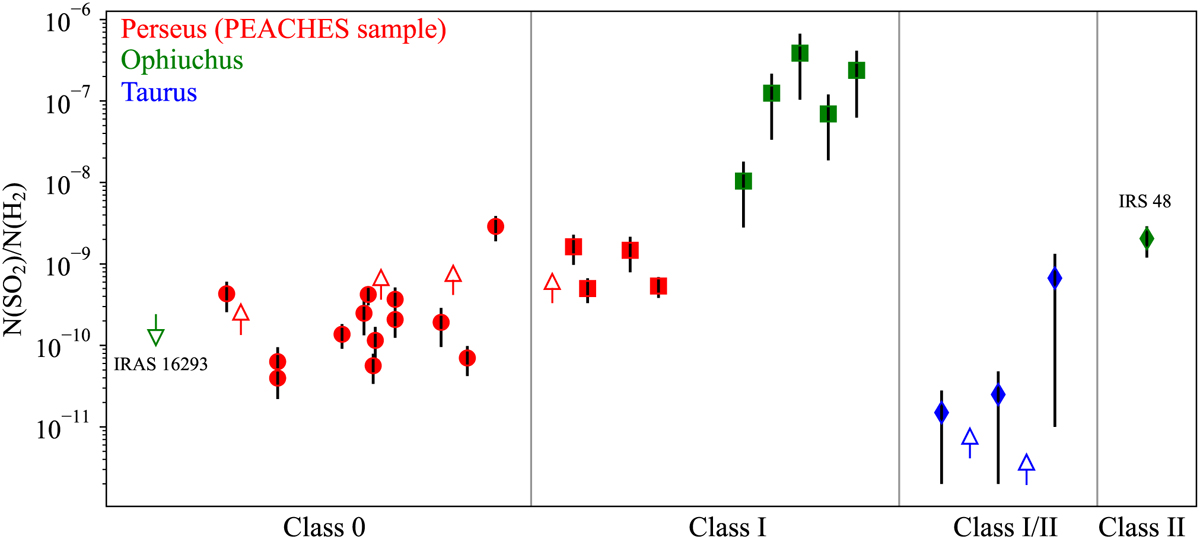
Column density ratio between SO2 and H2 for sources in different evolutionary stages. Red, green, and blue symbols represent sources from Perseus, Ophiuchus, and Taurus, respectively. Dots indicate Class 0 sources, squares represent Class I sources, and diamonds show Class I/II and Class II sources. Empty triangles indicate upper or lower limits. Values for IRAS 16295 were taken from Drozdovskaya et al. (2018) and Jørgensen et al. (2016). Perseus sources are from this work, Ophiuchus Class I sources correspond to IRS 67, GSS30-IRS1, IRS 44, IRS 43, and Elias 29, from left to right, studied by Artur de la Villarmois et al. (2019), and Taurus sources are taken from Garufi et al. (2022) and represent DG Tau (outer disk), HL Tau (inner disk), HL Tau (outer disk), IRAS 04302, and T Tau S, from left to right. The upper limit for IRAS 16293 is given by the optically thick continuum emission and lower limits for Perseus and Taurus sources are given by optically thick SO2 emission. The PEACHES sample and Class I Ophiuchus sources are ordered by Tbol.
Current usage metrics show cumulative count of Article Views (full-text article views including HTML views, PDF and ePub downloads, according to the available data) and Abstracts Views on Vision4Press platform.
Data correspond to usage on the plateform after 2015. The current usage metrics is available 48-96 hours after online publication and is updated daily on week days.
Initial download of the metrics may take a while.