Fig. 11
Download original image
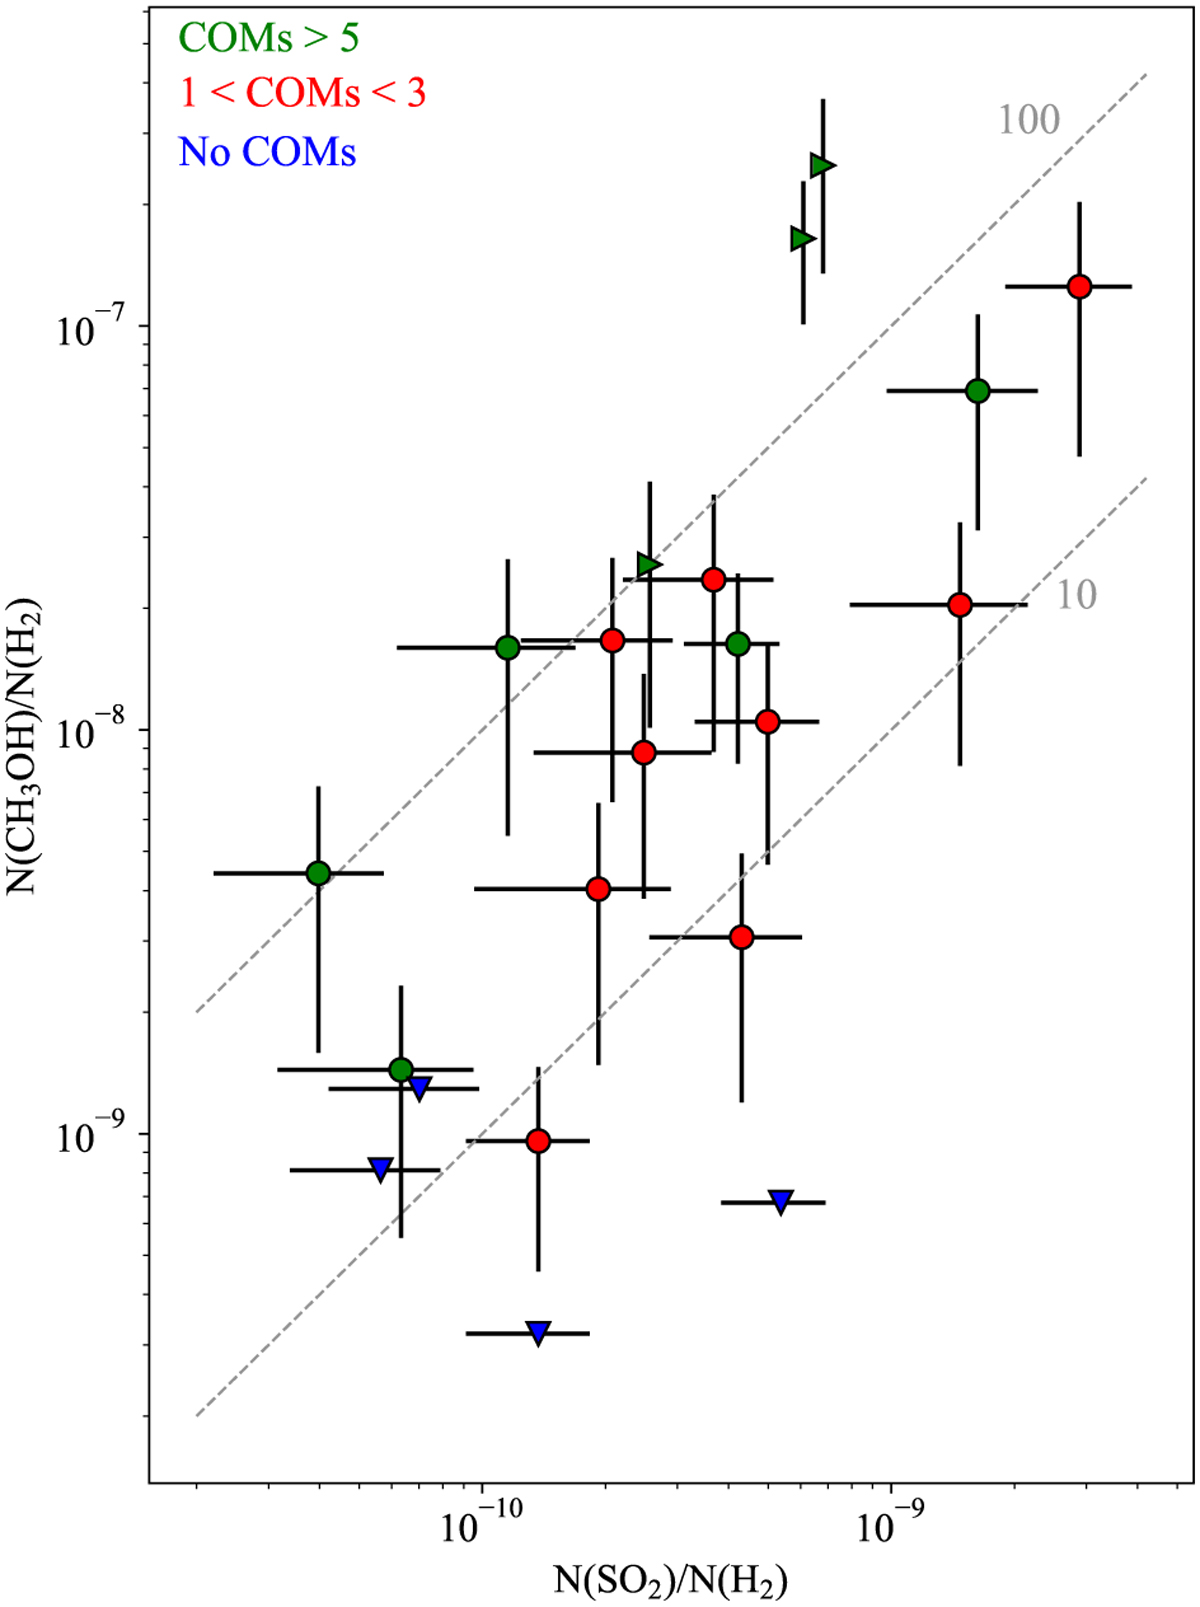
CH3OH abundance as a function of the SO2 abundance for the sources in Fig. 10. The different colors represent those sources where more than five different COMs were detected (green), between one and three different COMs were detected (red), and no COMs (blue) were detected in Yang et al. (2021). Gray dashed lines show a 10:1 and 100:1 linear correlation.
Current usage metrics show cumulative count of Article Views (full-text article views including HTML views, PDF and ePub downloads, according to the available data) and Abstracts Views on Vision4Press platform.
Data correspond to usage on the plateform after 2015. The current usage metrics is available 48-96 hours after online publication and is updated daily on week days.
Initial download of the metrics may take a while.