Fig. 10
Download original image
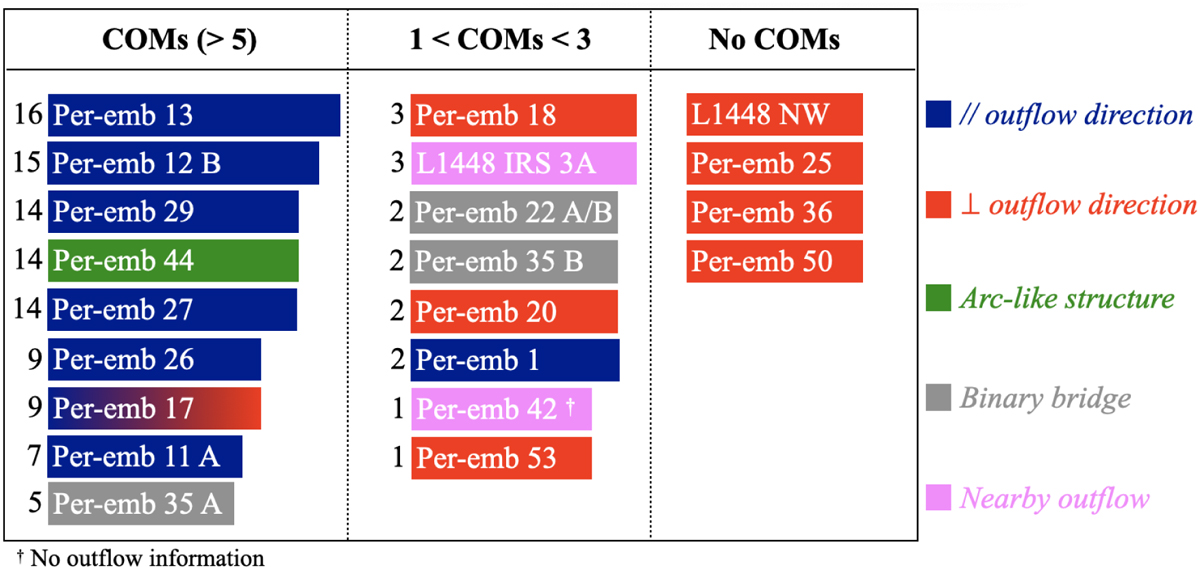
S-bearing species vs. COMs detection. Sources with detection of SO2 are clustered by the amount of detected COMs in Yang et al. (2021). The numbers on the left of the source names indicate the amount of different COMs detected. The different colors indicate where the emission of CS or SO is seen. Those sources where the CS or SO emission is parallel to the outflow direction are usually rich in COMs, while sources where the CS or SO emission is perpendicular to the outflow direction do not show detection of COMs.
Current usage metrics show cumulative count of Article Views (full-text article views including HTML views, PDF and ePub downloads, according to the available data) and Abstracts Views on Vision4Press platform.
Data correspond to usage on the plateform after 2015. The current usage metrics is available 48-96 hours after online publication and is updated daily on week days.
Initial download of the metrics may take a while.