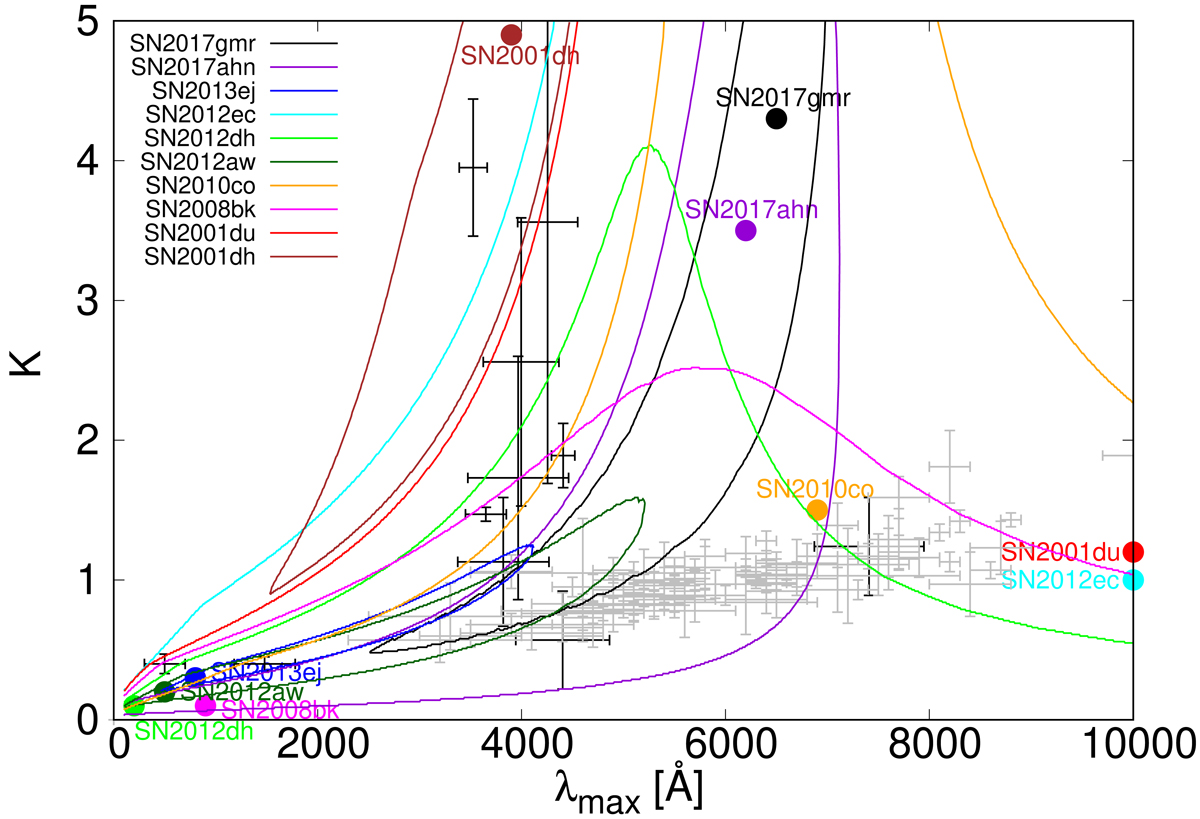
Fig. 3.
Download original image
ISP λmax–K diagram for the Type II SNe in this study. Several Type Ia SNe (black crosses; Patat et al. 2015; Zelaya et al. 2017; Cikota et al. 2018) and a large number of MW stars (gray crosses; Whittet et al. 1992) are also included. The colored points show the best-fit values of the Type II SNe, and the lines represent the 1σ confidence intervals for the fitting.
Current usage metrics show cumulative count of Article Views (full-text article views including HTML views, PDF and ePub downloads, according to the available data) and Abstracts Views on Vision4Press platform.
Data correspond to usage on the plateform after 2015. The current usage metrics is available 48-96 hours after online publication and is updated daily on week days.
Initial download of the metrics may take a while.