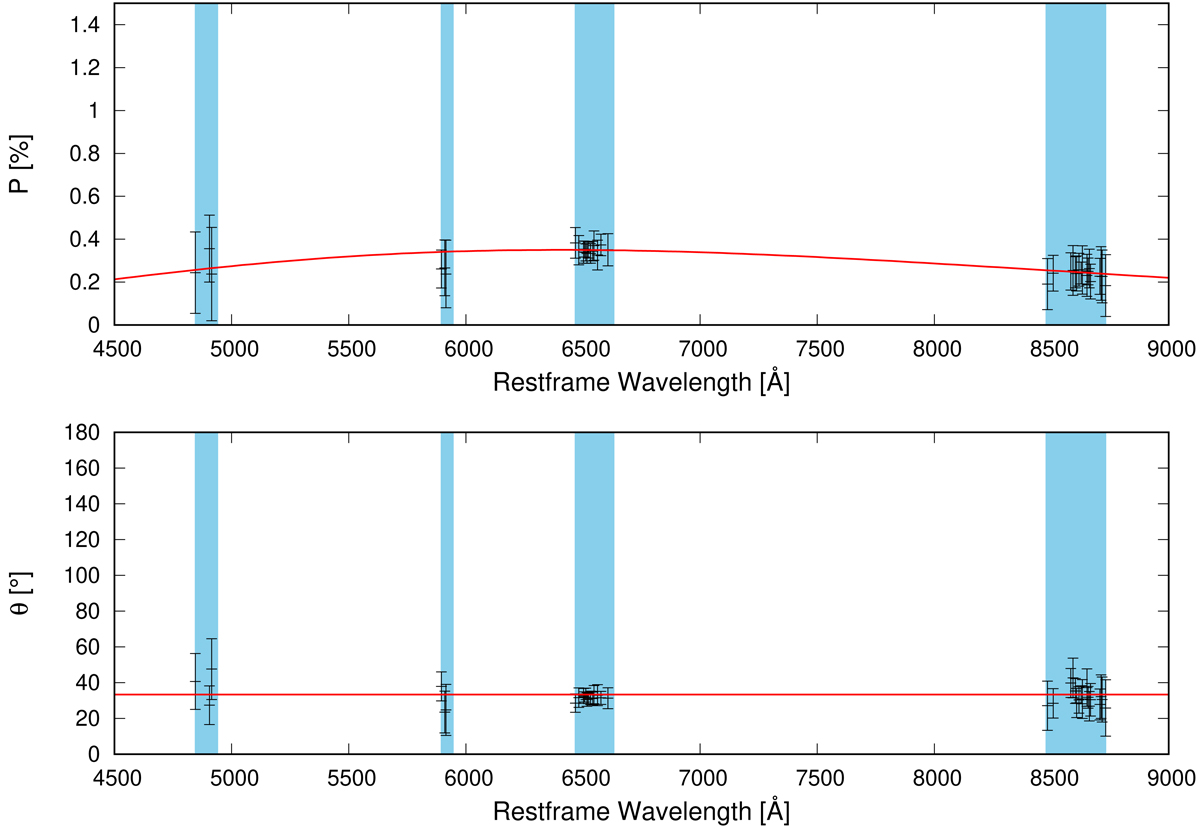
Fig. 2.
Download original image
Polarization degree P (top panel) and angle θ (bottom panel) selected for the determination of the ISP in SN 2017gmr. The red lines and the blue-shaded areas are the same as in Fig. 1. In each wavelength bin, the ISP values are the average over all five epochs, after removal of outliers as described in Sect. 4.1. The red lines show the best-fit ISP from Sect. 4.1 and Table 4.
Current usage metrics show cumulative count of Article Views (full-text article views including HTML views, PDF and ePub downloads, according to the available data) and Abstracts Views on Vision4Press platform.
Data correspond to usage on the plateform after 2015. The current usage metrics is available 48-96 hours after online publication and is updated daily on week days.
Initial download of the metrics may take a while.