Fig. D.1.
Download original image
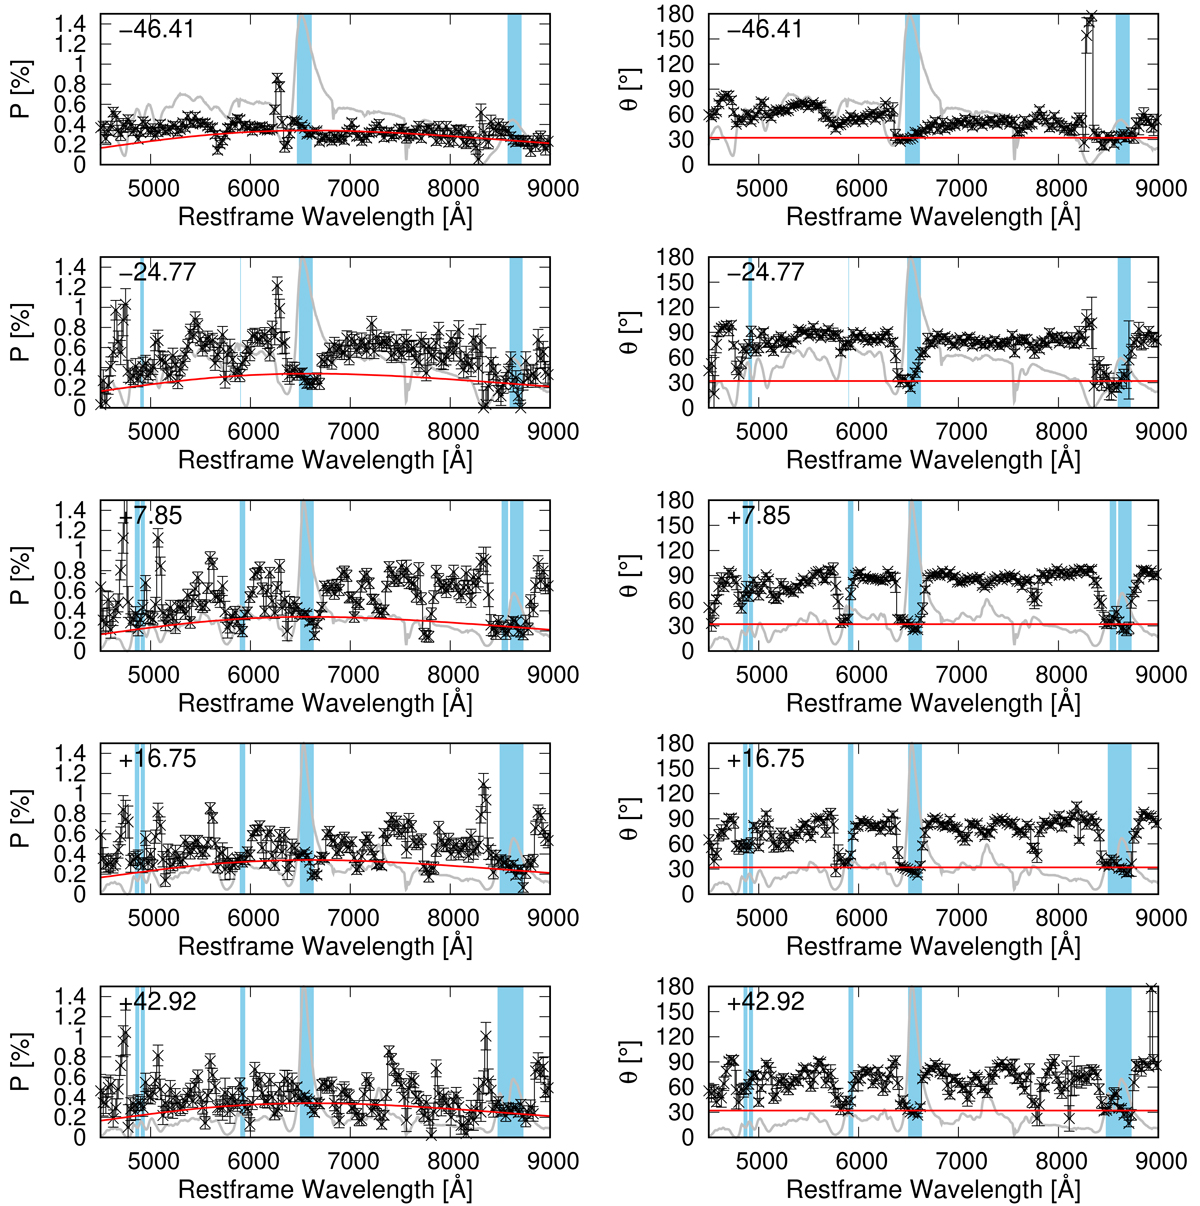
Polarization degree (left) and angle (right) of SN 2017gmr before the ISP subtraction at different epochs (increasing from the top to the bottom as labelled). The grey lines in the background of each plot are the unbinned flux spectra at the same epochs. The blue shading shows the adopted wavelength ranges for the emission lines at each epoch. The red lines show the best-fit ISP. The top-left number in each panel shows the phase (days relative to end of the photospheric phase; see Paper II).
Current usage metrics show cumulative count of Article Views (full-text article views including HTML views, PDF and ePub downloads, according to the available data) and Abstracts Views on Vision4Press platform.
Data correspond to usage on the plateform after 2015. The current usage metrics is available 48-96 hours after online publication and is updated daily on week days.
Initial download of the metrics may take a while.