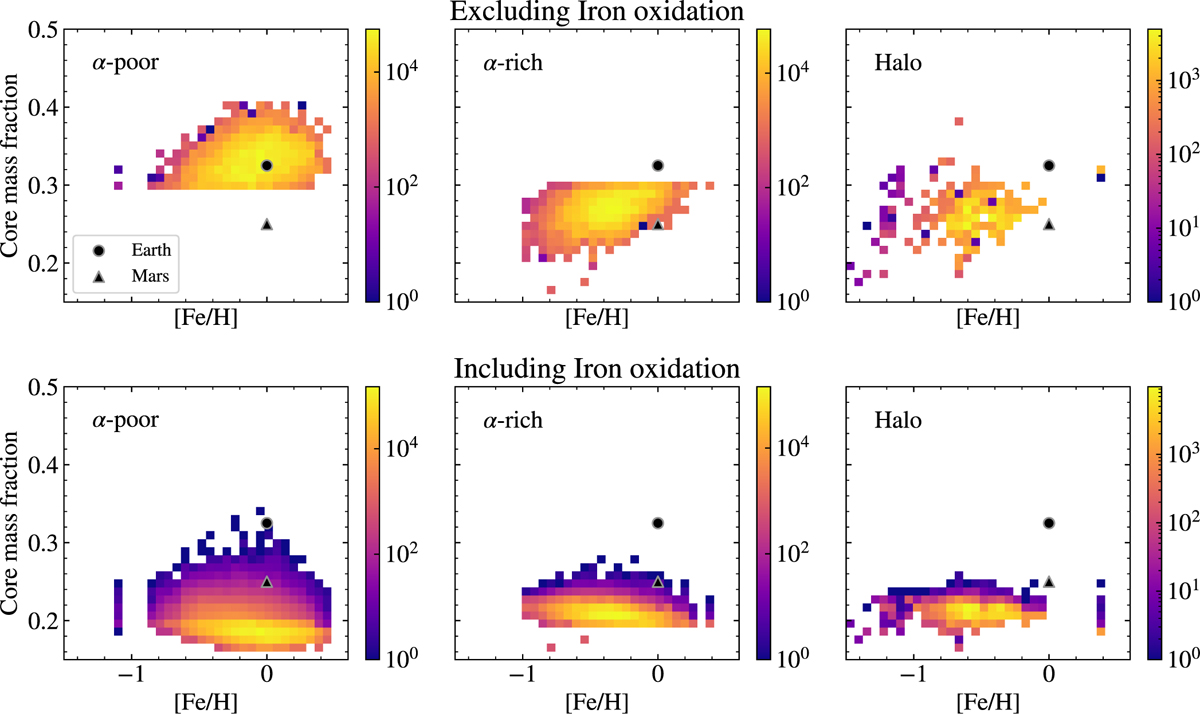
Fig. 14
Download original image
2D histogram of the core mass fraction as estimated by the mass of metallic iron and FeS compared to the total mass excluding water. We show results both excluding (top row) and including (bottom row) iron oxidation. When iron oxidation is excluded, the peak in the distribution in the α-poor sample increases from ~0.2 to ~0.35. Further, core mass fractions increase with increasing [Fe/H] in both the α-poor and α-rich sample. In contrast, when including iron oxidation, the core mass fractions are relatively flat with [Fe/H] in the α-poor and halo samples, while it decreases in the α-rich sample as the amount of iron available to become oxidised increases. The core mass fractions of planets around halo stars remain largely unaffected by iron oxidation as [Mg/Fe] is mostly flat with [Fe/H] for halo stars.
Current usage metrics show cumulative count of Article Views (full-text article views including HTML views, PDF and ePub downloads, according to the available data) and Abstracts Views on Vision4Press platform.
Data correspond to usage on the plateform after 2015. The current usage metrics is available 48-96 hours after online publication and is updated daily on week days.
Initial download of the metrics may take a while.