Fig. 1
Download original image
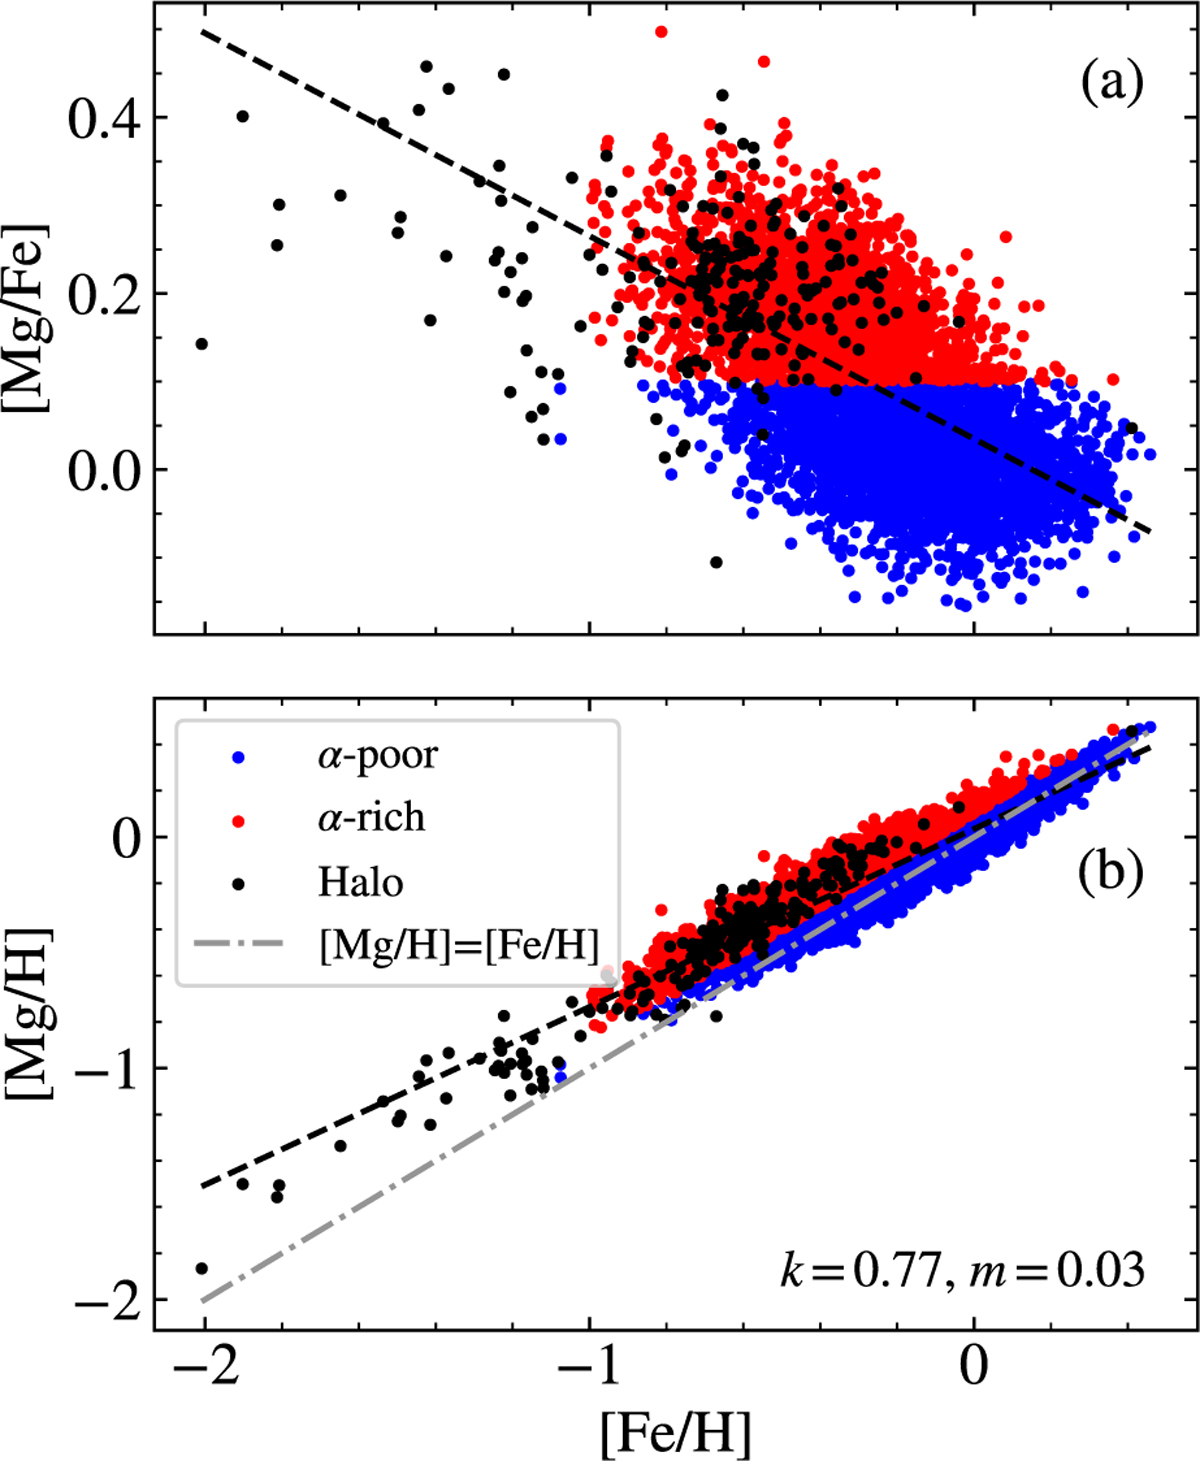
Stellar abundances for our stellar sample where we have colour-coded the stars belonging to each population. (a): [Mg/Fe] as a function of [Fe/H]. (b): [Mg/H] as a function of [Fe/H] for the same stars as in the top panel. We also show the linear fit between [Mg/H] and [Fe/H] for each population which was used to determine all the other elements except for He. The fit slope (k) and intercept (m) for the full sample are shown in the bottom right. In both panels, the dashed black line shows the fit when considering the entire stellar sample.
Current usage metrics show cumulative count of Article Views (full-text article views including HTML views, PDF and ePub downloads, according to the available data) and Abstracts Views on Vision4Press platform.
Data correspond to usage on the plateform after 2015. The current usage metrics is available 48-96 hours after online publication and is updated daily on week days.
Initial download of the metrics may take a while.