Fig. 5.
Download original image
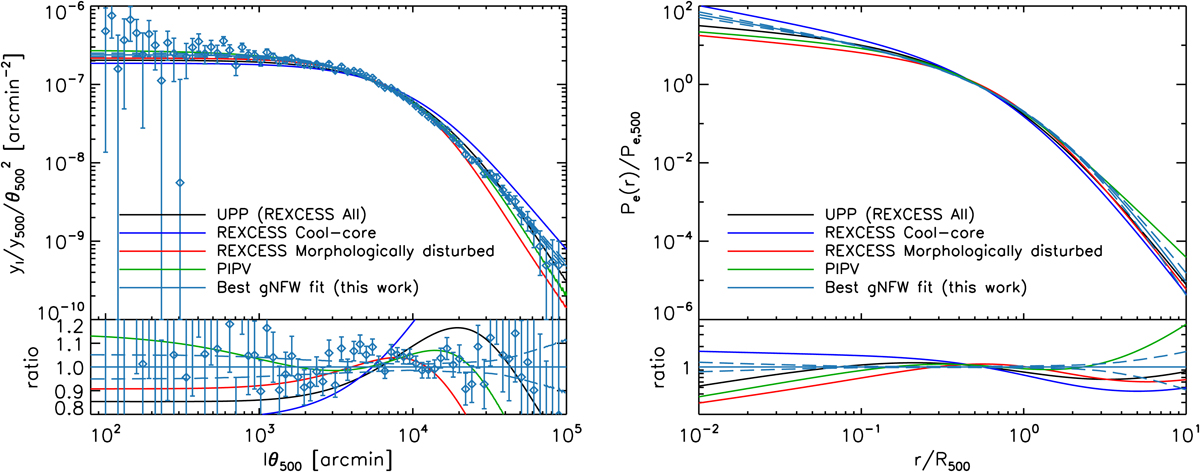
Average pressure profile. Left: average rescaled harmonic transform Compton parameter joint measurement and best fitting gNFW model, with the REXCESS and PIPV profiles overplotted for comparison. The best fit (solid blue line) is close to the UPP at large lθ500 (the central regions), and to the PIPV profile at small lθ500 (the outer regions). Right: corresponding 3D pressure profiles. In both panels the dashed blue lines delineate the 68% C.L. uncertainties of our best fitting gNFW profile.
Current usage metrics show cumulative count of Article Views (full-text article views including HTML views, PDF and ePub downloads, according to the available data) and Abstracts Views on Vision4Press platform.
Data correspond to usage on the plateform after 2015. The current usage metrics is available 48-96 hours after online publication and is updated daily on week days.
Initial download of the metrics may take a while.