Fig. 4.
Download original image
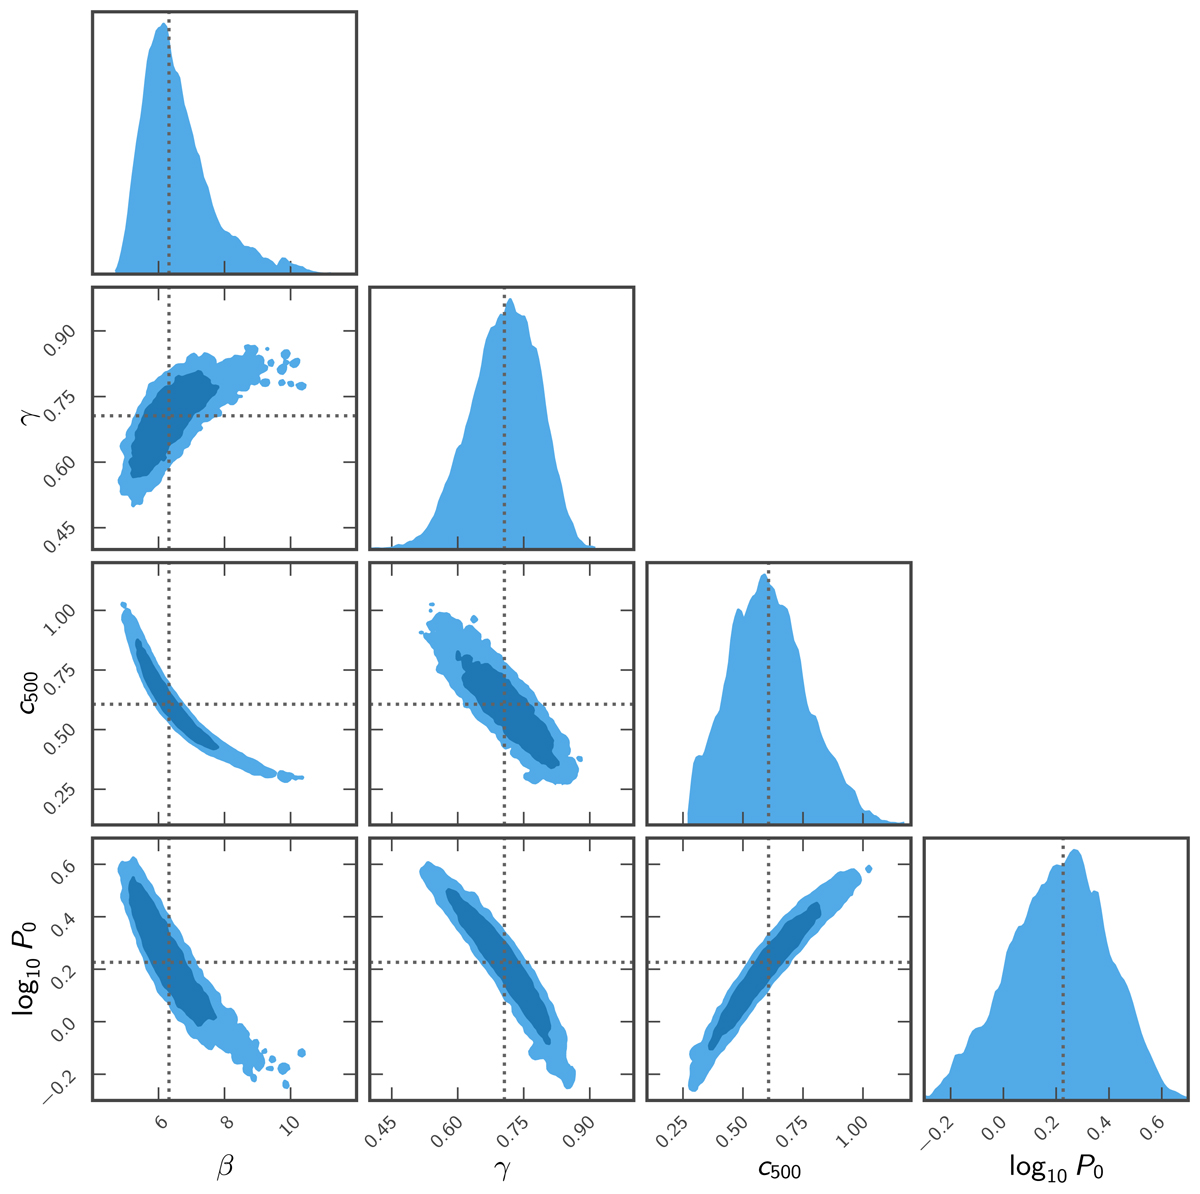
Marginalised posterior likelihood for the parameters of the best-fitting gNFW model (Eq. (7)) with fixed α = 1.05. Contours represent the 68% and 95% confidence regions. Blue contours show the results for the fit to the full data set; the dotted blue lines show the best-fitting value of each parameter as reported in Table 1.
Current usage metrics show cumulative count of Article Views (full-text article views including HTML views, PDF and ePub downloads, according to the available data) and Abstracts Views on Vision4Press platform.
Data correspond to usage on the plateform after 2015. The current usage metrics is available 48-96 hours after online publication and is updated daily on week days.
Initial download of the metrics may take a while.