Fig. 3.
Download original image
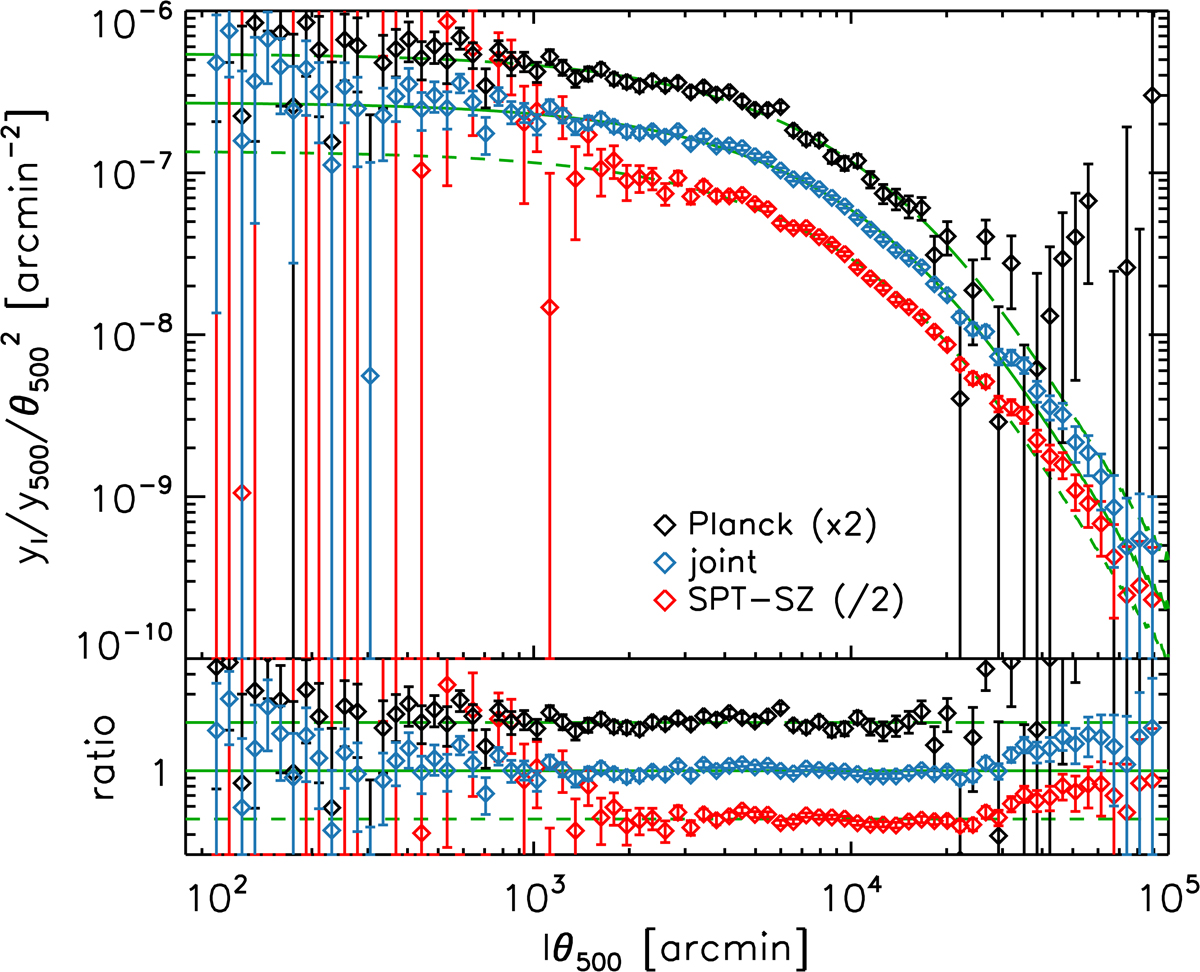
Average rescaled harmonic transform Compton parameter profile measurements from Planck only, SPT-SZ only and joint (Planck+SPT-SZ) in black, red and blue respectively. We multiplied (resp. divided) the Planck (resp. SPT-SZ) measurements by a factor two for clarity. The joint analysis allows to take advantage of the two data sets at all scales. The solid green line is the PIPV profile. The long dashed (resp. short dashed) green line is the PIPV profile multiplied (resp. divided) by a factor of two.
Current usage metrics show cumulative count of Article Views (full-text article views including HTML views, PDF and ePub downloads, according to the available data) and Abstracts Views on Vision4Press platform.
Data correspond to usage on the plateform after 2015. The current usage metrics is available 48-96 hours after online publication and is updated daily on week days.
Initial download of the metrics may take a while.