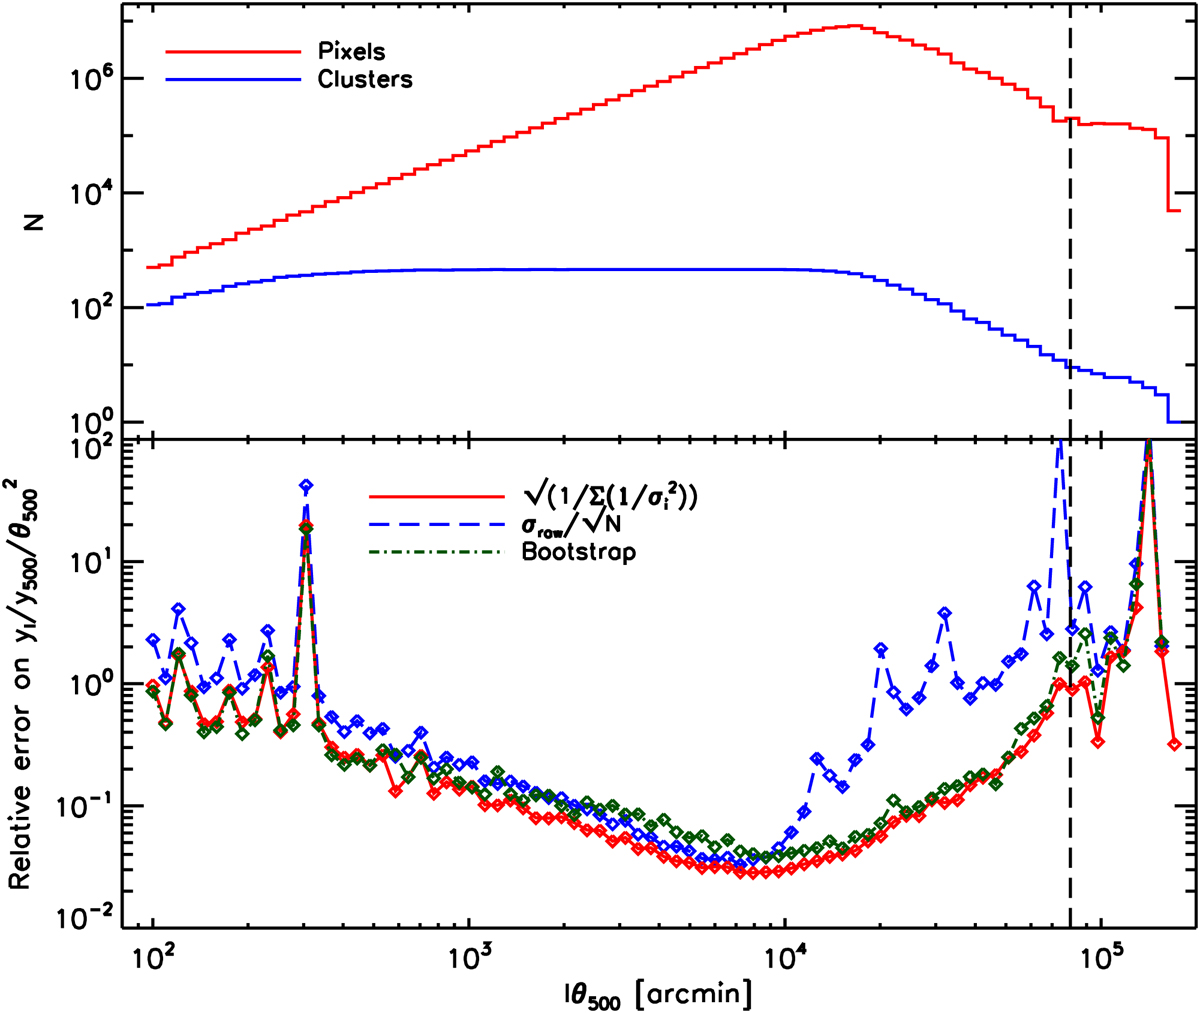
Fig. 2.
Download original image
Top: number of pixels and clusters contributing to measurement of the harmonic transform Compton parameter profile in a given lθ500 bin. See text in Sect. 3.6 for a description of the two histograms and their interplay. Bottom: relative error on the profile. The solid red line is the inverse variance weighted errors used throughout the analysis (shown as red error bars in Figs. 3 and 5). The dotted-dashed green line corresponds to bootstrap errors. The dashed blue line is the raw scatter in a given lθ500 bin divided by the square root of the number of clusters contributing to this bin.
Current usage metrics show cumulative count of Article Views (full-text article views including HTML views, PDF and ePub downloads, according to the available data) and Abstracts Views on Vision4Press platform.
Data correspond to usage on the plateform after 2015. The current usage metrics is available 48-96 hours after online publication and is updated daily on week days.
Initial download of the metrics may take a while.