Fig. E.2.
Download original image
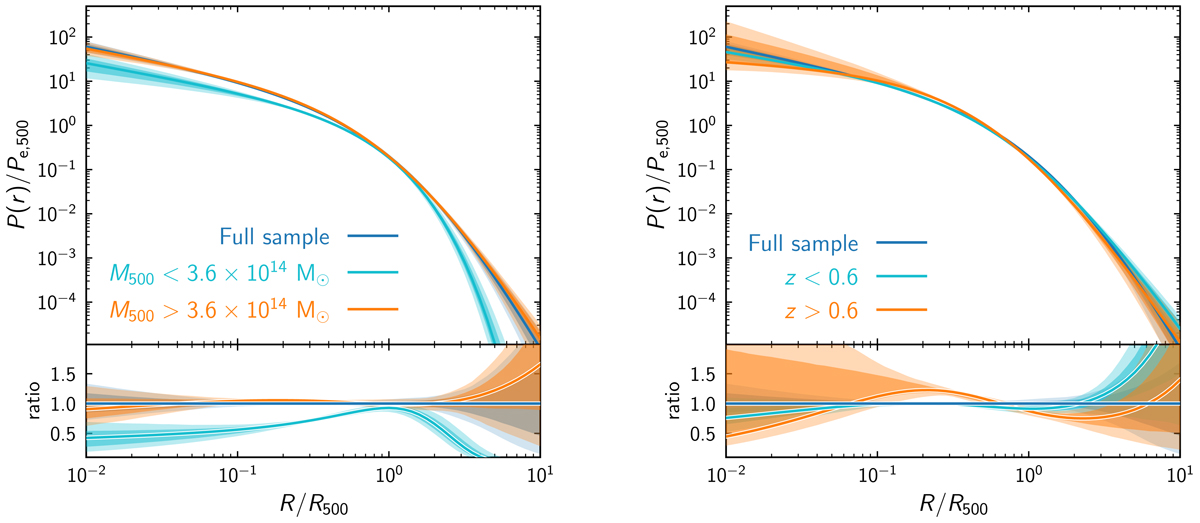
Best fitting pressure profiles in real space (solid lines) and associated 68% (dark) and 95% (light) C.L. envelopes from the MCMC chains. Left: Full sample (dark blue) compared to the low (cyan) and high (orange) mass subsamples. The bottom panel shows the ratio with respect to the full sample. Right: Same but for the low (cyan) and high (orange) redshift subsamples.
Current usage metrics show cumulative count of Article Views (full-text article views including HTML views, PDF and ePub downloads, according to the available data) and Abstracts Views on Vision4Press platform.
Data correspond to usage on the plateform after 2015. The current usage metrics is available 48-96 hours after online publication and is updated daily on week days.
Initial download of the metrics may take a while.