Open Access
Fig. A.1.
Download original image
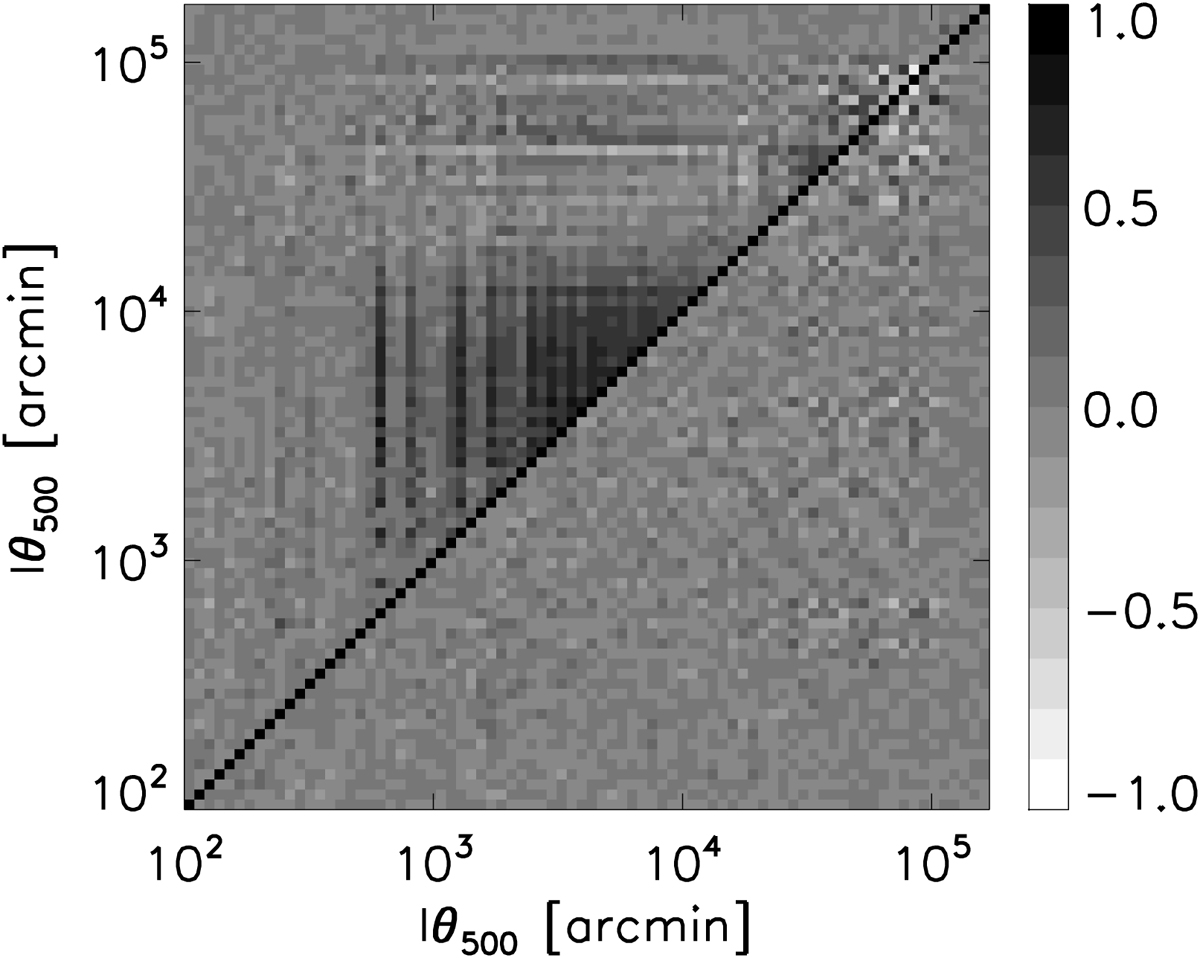
Correlation matrix ℛ between the lθ500 bins of the average cluster pressure profile estimated by bootstrap resampling. The top left half-matrix is estimated at the location of the clusters, the bottom right half is estimated on blank fields.
Current usage metrics show cumulative count of Article Views (full-text article views including HTML views, PDF and ePub downloads, according to the available data) and Abstracts Views on Vision4Press platform.
Data correspond to usage on the plateform after 2015. The current usage metrics is available 48-96 hours after online publication and is updated daily on week days.
Initial download of the metrics may take a while.