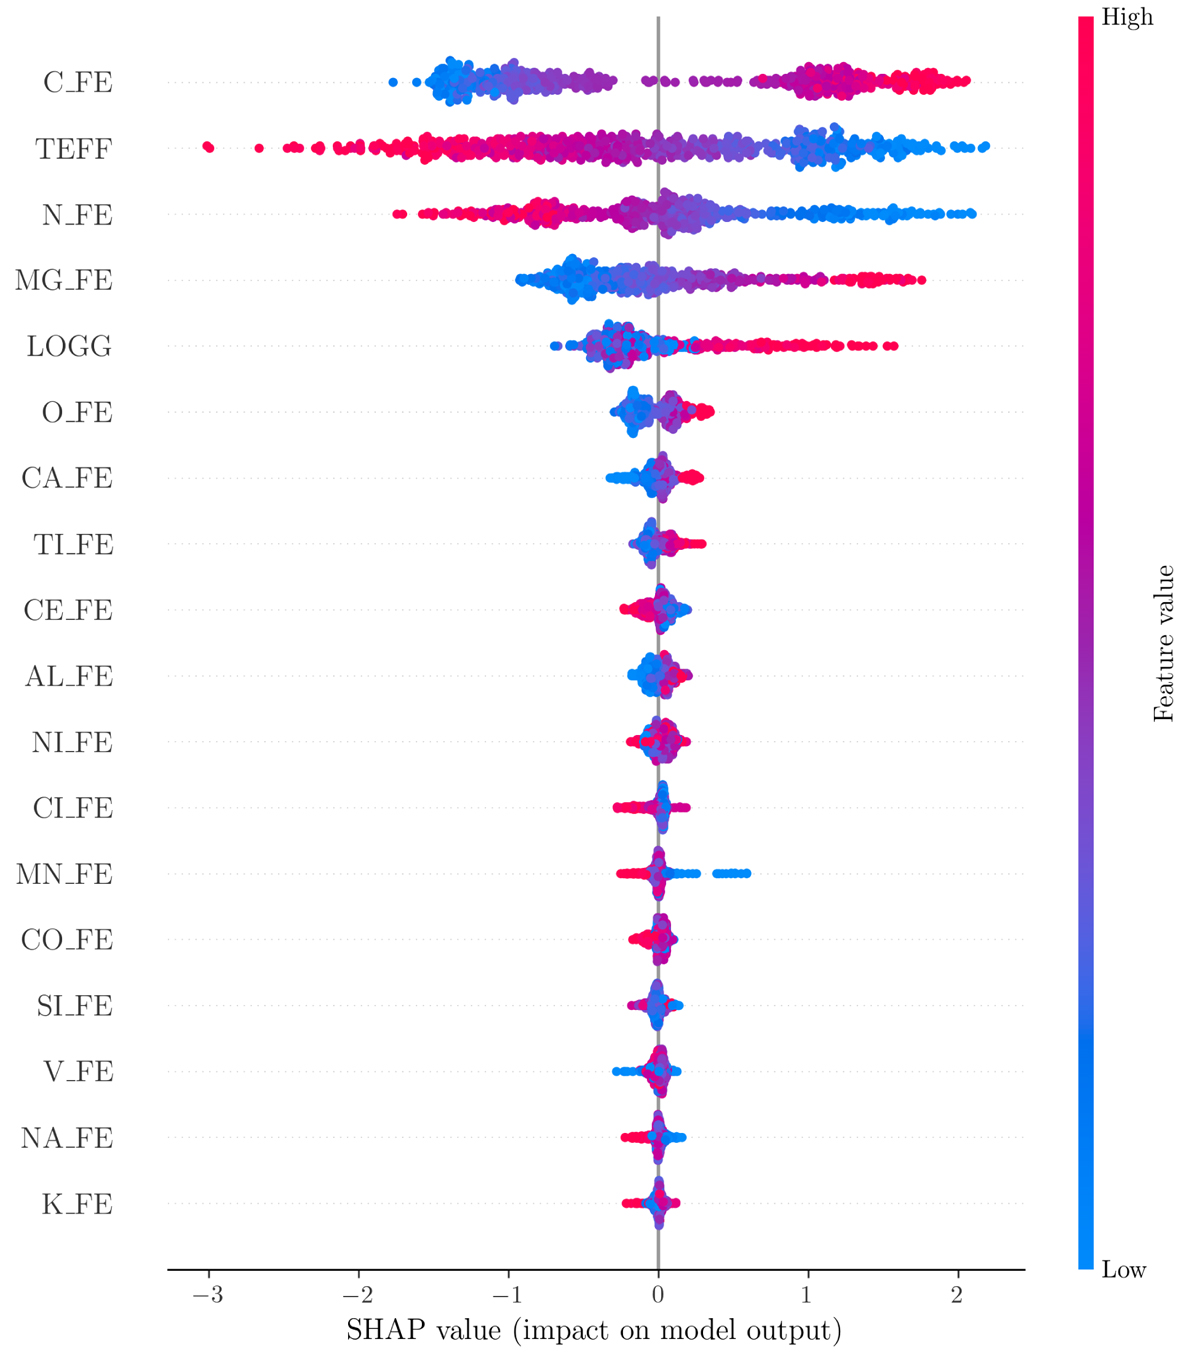
Fig. 3.
Download original image
SHAP “bee-swarm” plot (https://shap.readthedocs.io/en/latest/example_notebooks/api_examples/plots/beeswarm.html). The rows correspond to the input features, ordered by importance. In each row, one dot corresponds to a star in the test dataset, coloured by its (normalised) feature value. The position of each dot indicates how much and in which way each feature contributes to its output label (age).
Current usage metrics show cumulative count of Article Views (full-text article views including HTML views, PDF and ePub downloads, according to the available data) and Abstracts Views on Vision4Press platform.
Data correspond to usage on the plateform after 2015. The current usage metrics is available 48-96 hours after online publication and is updated daily on week days.
Initial download of the metrics may take a while.