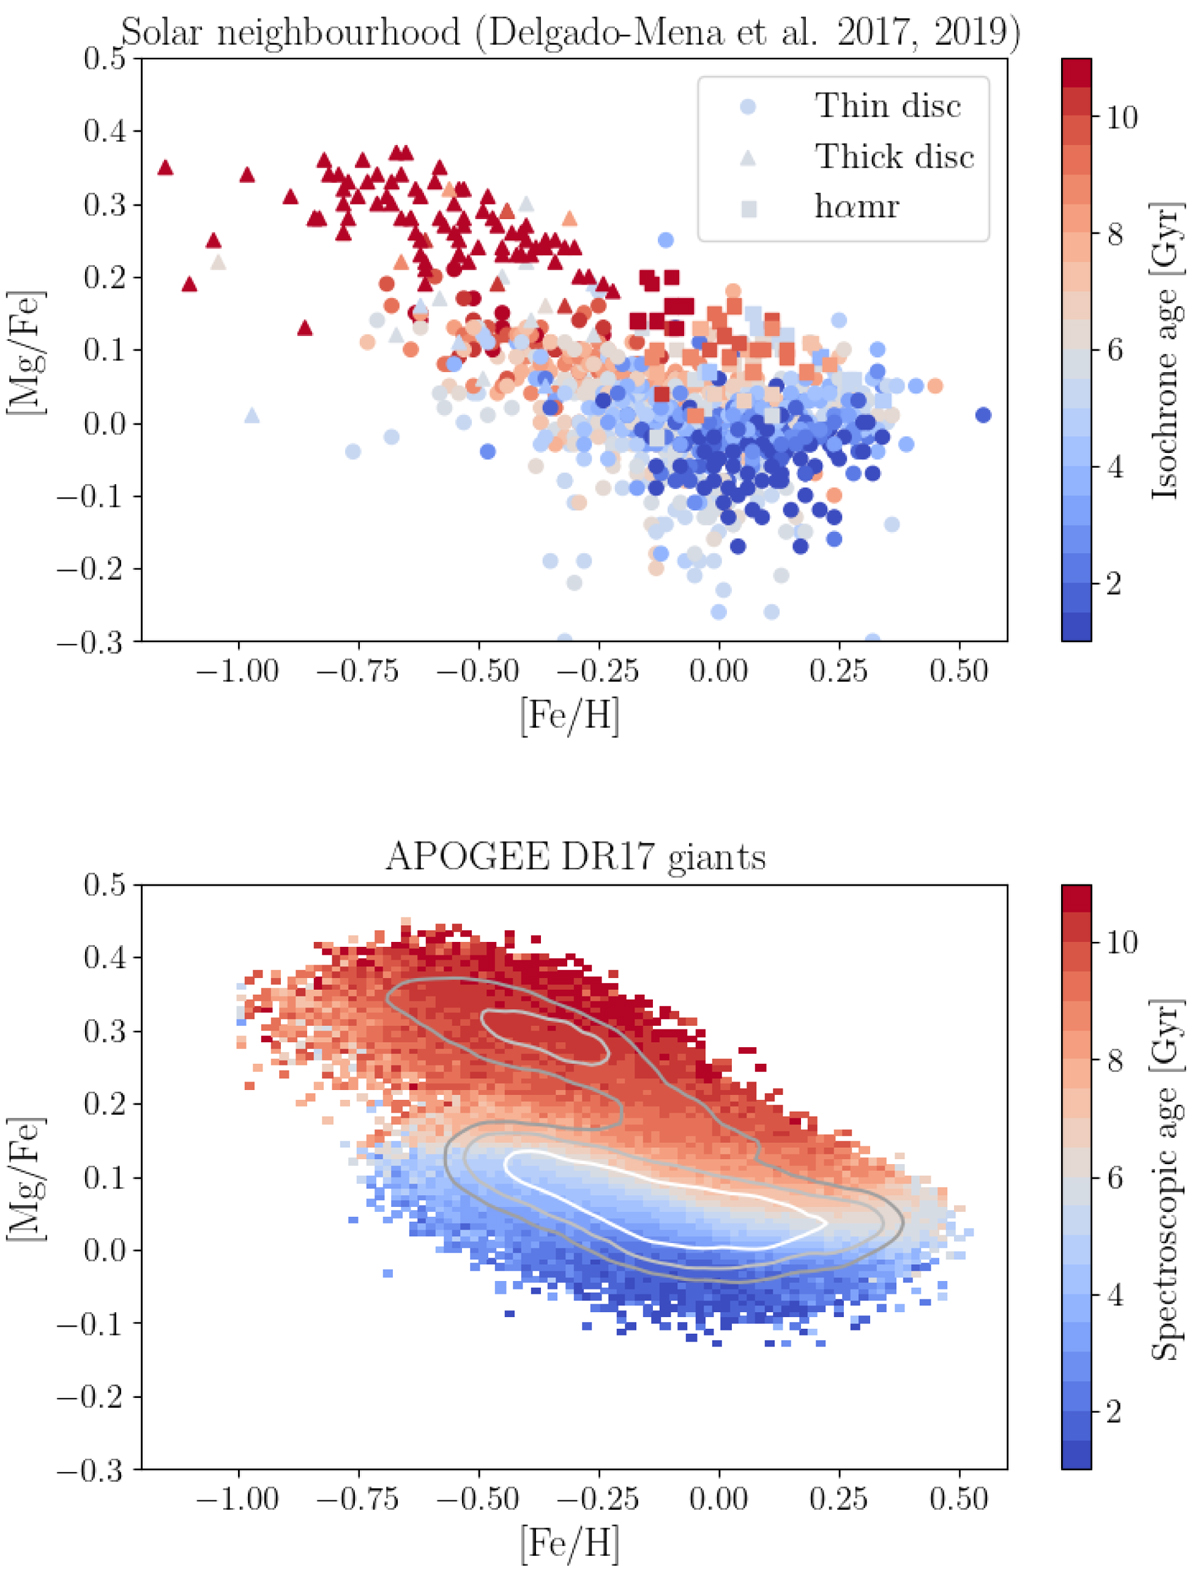
Fig. C.2.
Download original image
[Mg/Fe] vs. [Fe/H] Tinsley diagram colour-coded by stellar age. Top panel: scatter plot for the high-resolution solar-vicinity sample of Delgado Mena et al. (2019), using the same symbols as in the original publication. Bottom panel: Median age per pixel in the [Mg/Fe] vs. [Fe/H] diagram for our 200 000 APOGEE DR17 giants. Overplotted are iso-density contours corresponding to 40, 80, and 160 stars per bin.
Current usage metrics show cumulative count of Article Views (full-text article views including HTML views, PDF and ePub downloads, according to the available data) and Abstracts Views on Vision4Press platform.
Data correspond to usage on the plateform after 2015. The current usage metrics is available 48-96 hours after online publication and is updated daily on week days.
Initial download of the metrics may take a while.