Fig. 8.
Download original image
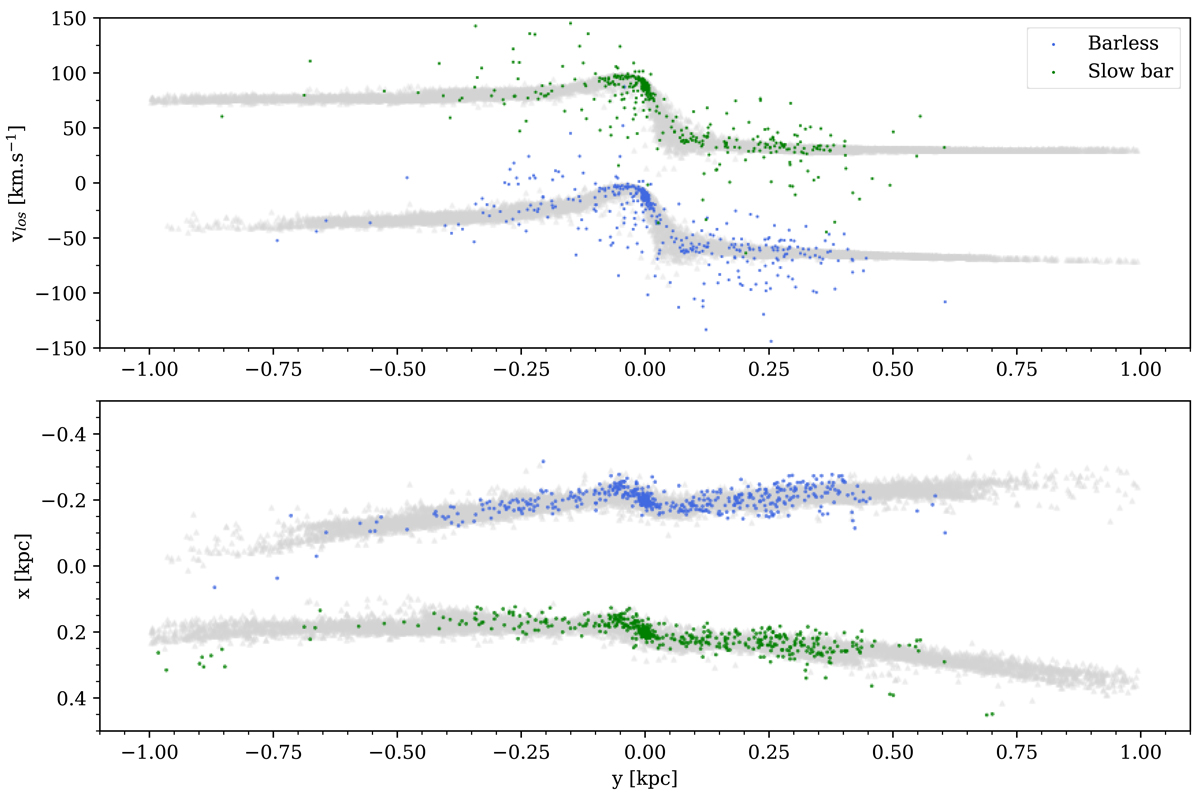
LoS velocity (upper panel) and the Galactocentric position (lower panel) of the candidate member stars selected with our Bayesian method for the barless model (blue points) and for the slow bar model (green points). In both panels, the grey points highlight the track of the simulated stream for each model. The positions of the points have been shifted vertically of ±0.2 kpc w.r.t. to the current position of the Hyades cluster in the lower panel and of ±50 km s−1 in the upper panel to separate both selections.
Current usage metrics show cumulative count of Article Views (full-text article views including HTML views, PDF and ePub downloads, according to the available data) and Abstracts Views on Vision4Press platform.
Data correspond to usage on the plateform after 2015. The current usage metrics is available 48-96 hours after online publication and is updated daily on week days.
Initial download of the metrics may take a while.