| Issue |
A&A
Volume 670, February 2023
|
|
|---|---|---|
| Article Number | A123 | |
| Number of page(s) | 9 | |
| Section | Extragalactic astronomy | |
| DOI | https://doi.org/10.1051/0004-6361/202244344 | |
| Published online | 14 February 2023 | |
Evolution of dark gaps in barred galaxies
1
Instituto de Astrofísica de Canarias, C/ Vía Láctea s/n, 38200 La Laguna, Tenerife, Spain
e-mail: This email address is being protected from spambots. You need JavaScript enabled to view it.
2
Departamento de Astrofísica de la Universidad de La Laguna, Avenida Astrofisíco Francisco Sánchez s/n, 38205 La Laguna, Tenerife, Spain
3
Department of Physics, University of Wisconsin-Madison, 475 North Charter Street, Madison, WI 53706, USA
4
Department of Astronomy, University of Wisconsin-Madison, 475 North Charter Street, Madison, WI 53706, USA
5
Instituto de Astronomía de Ciencias Planetarias, Universidad de Atacama, Avenida Copayapu 485 Copiapó, Chile
Received:
24
June
2022
Accepted:
17
November
2022
Abstract
Context. Recent studies show that barred galaxies have a light deficit, called a dark gap (DG), in the direction of the bar minor axis with respect to the major axis. The properties of these DGs might be related to the properties of the bars and to the location of some resonances of the galaxies.
Aims. We have analyzed the evolution of the DGs properties in the barred galaxy of the GALAKOS simulation to compare them with those from real galaxies and infer conclusions about the evolutionary status of the bars.
Methods. The DGs were measured by using the bar and the interbar surface brightness profiles from the Fourier decomposition of the light of the galaxies. We characterized them by two parameters: the prominence of the DG (Δμmax), and its location in the galaxy (RDG).
Results. In the GALAKOS simulation, both Δμmax and RDG evolve with time. Thus, the DGs are more prominent and are located at larger radii as the bar evolves. In addition, RDG is smaller than the bar radius (Rb) at all time steps of the simulation, being always Rb/RDG > 1.2. About 90% of the real galaxies show Rb/RDG > 1.2 similar to the GALAKOS simulation. For these objects, the ratio of the corrotation radius (RCR) and the DG radius is RCR/RDG ≈ 1.8. This is similar to the expected ratio of the corrotation resonance (CR) and the ultraharmonic resonance (UHR) radius. This indicates a link between the DGs and the UHR of these galaxies. The remaining 10% of the galaxies show Rb/RDG < 1.2 and RCR/RDG ≈ 1. In these cases, the DG would be linked with the CR of the galaxy. We have found that the bar in GALAKOS, as well as real bars in galaxies, can be located in distinct places on the RCR/h − Rb/h plane based on the prominence of their DGs. In particular, galaxies with high values of Δμmax are located at RCR/h and Rb/h larger than 1.5. The simulated bar turned to be a slow rotator when Δμmax was larger than 0.8. When this occurs, RCR/h and Rb/h are larger than 2.0 and 1.5, respectively, for the GALAKOS bar.
Conclusions. The location of the DG seems to be a robust signature of the location of the galaxy resonances. In addition, the prominence of the DG could be used as indicators of the amount of angular momentum exchange by the bar and other galactic components. Galaxies with Δμmax > 0.8 would be candidates for slow bar rotators. In addition, flat bars would be more evolved or would have exchanged more angular momentum than exponential bars.
Key words: galaxies: structure / galaxies: evolution
© The Authors 2023
 Open Access article, published by EDP Sciences, under the terms of the Creative Commons Attribution License (https://creativecommons.org/licenses/by/4.0), which permits unrestricted use, distribution, and reproduction in any medium, provided the original work is properly cited.
This article is published in open access under the Subscribe-to-Open model. This email address is being protected from spambots. You need JavaScript enabled to view it. to support open access publication.
1. Introduction
Bars are elliptical structures that are located in the inner parts of a large fraction of disk galaxies. Observational studies conclude that bars are present in at least 50% of the optical images of nearby galaxies (Aguerri et al. 2009; Nair & Abraham 2010; Buta et al. 2015). In the near-infrared, this fraction increases up to 70% (Knapen et al. 2000). Bars can be formed by internal or external events. The Toomre parameter (Q) measures the stability of a differentially rotating disk to the growth of structure. In particular, a maximally rotating disk develops a bar structure when this Q parameter is larger than a threshold (Toomre 1964). Externally, the accretion of minor satellites (Aguerri et al. 2001; Eliche-Moral et al. 2006) or fast fly-by encounters with other galaxies (Martinez-Valpuesta et al. 2017; Łokas 2018, 2021) can activate the formation of bars in disks.
The fraction of barred galaxies strongly depends on some galaxy parameters such as the mass of the disk or the Hubble type. In particular, the peak of the bar fraction is located in galaxies with stellar disks with Mr ≈ −20.5 in clusters and Mr ≈ −19.0 in the field. Very luminous and dwarf galaxies both show smaller bar fractions. These galaxy types do not host thin disks, which might explain the smaller fractions. Therefore, bars are tracers of thin disks in galaxies (Méndez-Abreu et al. 2012). There is also a debate about the dependence of the bar fraction on Hubble type. Thus, some works found that the fraction of bars is smaller in S0 galaxies than in late-type ones (see, e.g., Aguerri et al. 2009). Larger bar fractions were found in galaxies with small bulges (n < 2 and B/T < 0.2; see Weinzirl et al. 2009). In addition, S0 bars are less prominent than bars in spiral galaxies (Buta et al. 2010). This suggests that bars avoid galaxies with large central bulges (Laurikainen et al. 2007). In contrast, other works found a larger fraction of bars in early-type galaxies (see, e.g., Masters et al. 2011). Moreover, the bar fraction also varies with redshift. Thus, more massive galaxies form bars structures earlier than less massive ones (Sheth et al. 2008).
Bars are characterized by three parameters: their length, their strength, and the pattern speed. The length of the bar is given by the bar radius (Rb) and is observationally determined with different methods that are mainly based on photometric images (see, e.g., Wozniak et al. 1995; Aguerri et al. 2000, 2009; Lee et al. 2020). The bar strength (Sb) represents the force of the non-axisymmetric perturbation to the gravitational potential of the disk (see Quillen et al. 1994; Laurikainen & Salo 2002). The pattern speed (Ωb) is the rotation pattern of the bar in the disk. This parameter determines the dynamics of the galaxy and is the most difficult one to measure. Several methods have been proposed in the literature for the measurement of Ωb (see Tremaine & Weinberg 1984; Cepa & Beckman 1990; Canzian 1993; Puerari & Dottori 1997; Aguerri et al. 2000; Buta & Zhang 2009; Font et al. 2011; Buta 2017). Numerical simulations of barred galaxies show that the three bar parameters change with time as the bar evolves. Thus, bars are shorter, weaker, and faster at early formation epochs, becoming longer, stronger, and slower with their evolution. The amount of variation of the bar parameters through the galaxy evolution is driven by the angular momentum exchanged between the bar and other galactic structures; it depends on different properties of the galaxies (see Debattista & Sellwood 2000; Athanassoula 2003; Athanassoula et al. 2013).
The bar evolution produces significant changes in the host disks. These changes are slow and take place on timescales of several billion years, producing the so-called secular evolution in galaxies. Bars affect the distribution of stars in galaxy disks. It has been observed that the scale length of the disks is about 15% longer in galaxies hosting bars than in those without bars (Sanchez-Janssen & Gadotti 2013). Moreover, a deficit of light in the surface brightness profiles along the minor bar axis has been measured with respect to that along the major bar axis (Kim et al. 2016; Buta 2017). We refer to this deficit of light as “dark gaps” (DGs; Buta 2017). Numerical simulations have shown that bars produce torques in the stars that produce changes in their orbits. In particular, bars grow by trapping stars in the inner parts of the disks. These stars, originally in nearly circular orbits in the disks, are forced by the bar torque to enlarge their orbit ellipticity and are trapped in elliptical orbits (x1 orbits), forming part of the bar. This process redistributes the stars within the bar region, producing changes in the surface brightness of the disks. In particular, this trapping process can explain the observed differences between the surface brightness profiles along the bar major and minor axis within the bar region (Kim et al. 2016). Another redistribution mechanism of the stellar angular momentum is radial migration. Stars located close to the corotation resonance (CR) can experience significant changes in their radial position caused by the torques exerted by bars or spiral arms (see Debattista et al. 2006; Minchev & Famaey 2010; Vera-Ciro et al. 2014, 2016).
Kim et al. (2016) analyzed the light deficit in barred galaxies by comparing their surface brightness profiles along the bar major and minor axis. They found that the maximum difference between these two profiles correlates with some galaxy parameters such as bar length, strength, and bar-to-total (Bar/T) luminosity ratio. They explained DGs in the context of trapping processes produced during the evolution of the bar. Buta (2017) analyzed a sample of barred galaxies with ring or pseudo-ring morphologies and prominent DGs in terms of its strength. He linked the radius of the DGs (RDG) with the position of the CR of the bars. Recent numerical simulations and an analysis of a sample of SDSS-IV (Blanton et al. 2017) Mapping Nearby Galaxies at Apache Point Observatory (MaNGA; Bundy et al. 2015) barred galaxies with and without ring morphologies have shown that RDG is linked with the 4:1 ultraharmonic resonance (UHR) of the bar rather than with the CR (Krishnarao et al. 2022).
We here use numerical simulations of barred galaxies similar to the Milky Way (MW) to understand the evolution and the formation mechanisms causing the DGs in the disks of barred galaxies. In addition, we measure the position of the DGs shown in a sample of well-studied barred galaxies. The RDG of these galaxies have been related with the position of their main resonances.
The paper is organized as follows. In Sect. 2 we show the evolution of the DGs properties by using the GALAKOS simulation. Section 3 shows the DGs properties for a sample of real barred galaxies. The discussion and conclusions are presented in Sects. 4 and 5, respectively.
2. Evolution of disks in simulated barred galaxies
Numerical simulations provide the opportunity to understand complex physical processes in galaxies. We took advance of the high-resolution N-body simulation called GALAKOS to investigate the phase-space evolution produced in the disk of an MW-like galaxy by the growth of nonasysimmetric structures (D’Onghia & Aguerri 2020).
2.1. GALAKOS simulation
GALAKOS is an N-body simulation reproducing a barred galaxy similar to the MW. It was carried out with GADGET3, a parallel treePM-smoothed particle hydrodynamics (SHP) code (Springel 2005). The details of the simulation can be found in D’Onghia & Aguerri (2020). We provide a brief summary below.
The GALAKOS simulation has one of the highest available resolutions. The initial conditions consist of about 90 million particles distributed in a dark matter halo, a rotationally supported disk, and a spherical stellar bulge. The mass distribution of the dark matter halo was modeled with a Hernquist profile (Hernquist 1990). This halo consisted of 60 million particles with a total mass of 1012 M⊙ and a scale length of 30 kpc. The disk mass was discretized with 24 million particles distributed according to an exponential radial profile with an isothermal vertical distribution. The mass, radial scale length, and scale height of the disks were 4.8 × 10¹⁰ M⊙, 2.67 kpc, and 320 pc. The bulge consisted of 8.4 million particles, as described by Hernquist (1990), with a total mass and scale length of 8 × 10⁹ M⊙ and 120 pc. The total barionic mass (disk and bulge) was 5.6 × 10¹⁰ M⊙. These quantities closely match the MW parameters (see Bland-Hawthorn & Gerhard 2016).
GADGET3 combines the high spatial resolution of tree algorithms with the speed and accuracy of the particle-mesh methods. This is possible because the gravitation field on large scales is computed with a particle-mesh algorithm, while the short-range forces are calculated using a tree-based hierarchical multiple expansion. Pairwise particle interactions are softened with a spline kernel of a certain scale length. The resulting gravitational softening lengths were fixed to 40 pc for the dark halo, 28 pc for the disk, and 40 pc for the bulge. The simulation was run for a time equivalent to 4 Gyr of the live of the galaxy.
2.2. Bar growth in the simulation
The GALAKOS simulation develops a strong bar structure in the simulated disk. This makes GALAKOS an ideal simulation for analyzing the evolution of the bar parameters such as radius (Rb), strength (Sb), and pattern speed (Ωb). The measurements of the bar strength and radius were carried out by decomposing the surface density distribution of the stellar particles into Fourier series in the simulation at different times. The Fourier decomposition technique has been extensively used in the literature to analyze the properties of barred galaxies (see Ohta et al. 1990; Aguerri et al. 2000; Díaz-García et al. 2016). In particular, barred galaxies show a strong m = 2 Fourier component with a prominent peak, which has been used as an indicator of the strength of the bar. In addition, Aguerri et al. (2000) designed a method for measuring the bar radius using the intensity contrast between the bar (Ib) and the interbar (Iib) profiles as a function of the radial distance. The bar intensity is defined by a combination of the Fourier modes as Ib = I0 + I2 + I4 + I6. The interbar intensity is given by Iib = I0 − I2 + I4 − I6, where Ii is the ith component of the Fourier decomposition of the surface density profile of the galaxy. In an ideal galaxy, the Ib and the Iib profiles are similar to the intensity profiles along its bar major and minor axis, respectively. Based on these intensity profiles, Aguerri et al. (2000) defined the bar radius as the larger radius at which Ibar/Iib = 0.5 × [max(Ibar/Iib)−min(Ib/Iib)] + min(Ib/Iib). This bar length method has been applied in several samples of galaxies and tested with numerical simulations with promising results (Athanassoula 2003).
The bar pattern speed in barred galaxies was determined in the literature by using different methods. In our case, Ωb of the simulated galaxy was obtained by computing the power spectra for the m = 2 harmonic mode, measured from snapshots sampled every 5 Myr and in time periods of 500 Myr (see D’Onghia & Aguerri 2020).
Figure 1 shows the evolution of the strength, radius, and pattern speed of the bar formed in the GALAKOS simulation. The bar strength was obtained from the peak of the m = 2 Fourier amplitude (A2, max), and the bar radius (Rb) was measured by using the method from Aguerri et al. (2000). The evolution of these two parameters shows three main epochs in the bar evolution. After ≈0.5 Gyr, a weak non-axysimetric structure starts to grow in the central region of the disk of the simulated galaxy. The first epoch of the bar evolution takes place until ∼1 Gyr. This period is characterized by a fast growth of the bar. During the second epoch, corresponding to between 1 Gyr to 1.5 Gyr, the bar fluctuates in its length and shows a constant strength. The third epoch of the evolution starts at ∼1.5 Gyr and takes place until the end of the simulation (4 Gyr). During this epoch, the bar continuously grows in radius and strength. This growth is slower than in the previous epochs of the evolution, however. This last epoch can be associated with the so-called secular evolution phase. At the end of the simulation, a strong and long bar has formed in the disk of the galaxy. After 4 Gyr of evolution, the bar has a radius of ≈4.5 kpc and A2, max ≈ 1.0. The bar pattern speed is not constant across time (see Fig. 1). In particular, Ωb ≈ 55 km s−1 kpc−1 at 1.5 Gyr and 30 km s−1 kpc−1 at 4 Gyr. This decrement is produced by the exchange of the angular momentum between the bar and other galaxy components (see Debattista & Sellwood 2000; Athanassoula 2003).
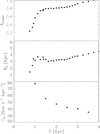 |
Fig. 1. Time evolution of the bar parameters of the GALAKOS simulation: strength (upper panel), length (middle panel), and pattern speed (lower panel). |
2.3. Phase-space changes in the disk of the simulated galaxy
The growth of the bar produces significant changes in the inner regions of the disk. Previous numerical simulations have shown that the phase-space redistribution of the stellar disk due to the bar produces a change in the disk scale-length by a factor up to ∼2.4 (see Valenzuela & Klypin 2003; Debattista et al. 2006). This contradicts observations that support mild or no evolution (see Lilly et al. 1998; Simard et al. 1999; Barden et al. 2005; Sanchez-Janssen & Gadotti 2013). We investigated the effect of the bar that formed in our simulation on the scale length of the disk.
Figure 2 shows the time evolution of the scale length of the disk (h) in the GALAKOS model. The initial scale length of the exponential disk is 2.6 kpc, similar to the disk of the MW. After 4 Gyr of evolution, the scale length increases by a factor 1.07. This factor is much smaller than others obtained from numerical simulations, and it matches observations. Thus, Sanchez-Janssen & Gadotti (2013) found that scale lengths of the disks of barred galaxies were about 1.15 longer than those in similar galaxies without bars. The increment of the scale length in the GALAKOS simulation accounts for about half of the increment observed in the scale lengths of disks in barred galaxies. Nevertheless, we have to point out that GALAKOS is a simulated galaxy, evolving in isolation. The environment can play an important role in the structural parameters of galaxy disks (see, e.g., Aguerri et al. 2000, 2001; Gutiérrez et al. 2004). In addition, the GALAKOS simulation contains no gas. However, we do not expect significant differences in the h evolution in simulated disks with gas, since in real galaxies the values of h does not depend on the Hubble type (see, e.g., Möllenhoff & Heidt 2001; Aguerri et al. 2004).
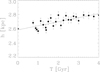 |
Fig. 2. Time evolution of the disk scale length of the simulated galaxy. |
The formation of a bar in the disk can also produce effects on the surface density of the stars in the inner regions of the disk. Figure 3 shows the azimuthal average, bar, and interbar surface density profiles at four different times of the simulation. At the beginning of the bar formation (0.75 Gyr), the three profiles were similar. As the bar grew in strength and length, the bar and interbar profiles became different. This evolution of the density profiles has been observed in other numerical simulations of barred galaxies (Athanassoula 2003; Kim et al. 2016). They were interpreted as the phase-space redistribution in the inner regions of the disk produced by the bars evolution. In particular, the bar grows in length and strength by trapping particles in elongated x1 orbits, forming the bar. This mechanism produces an increase in surface density profiles along the bar major axis (bar profiles) and a decrease in the profiles perpendicular to the bar (interbar profiles). The difference in the surface density between the bar major- and minor-axis profiles is the so-called DG.
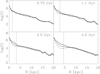 |
Fig. 3. Azimuthal average surface density profile (small points), bar profile (full line), and interbar profile (dashed line) at four different time steps of the simulations. The vertical line represents the bar radius for each of the snapshots. |
To quantify the properties of the DGs, we defined the quantity Δμ(R)=log(Ib(R)) − log(Iib(R)) for a given time. This quantity provides the difference between the bar and interbar surface density profiles as a function of galactrocentric radius (R) and for a given time. The radius, RDG, where Δμ(RDG) = max(Δμ(R)) was defined as the dark gap radius, and Δμmax = Δμ(RDG) were considered as the prominence of the DG. Figure 4 shows the evolution of Δμmax for the GALAKOS simulation. A sharp growth of Δμmax until ≈1 Gyr from the beginning of the simulation is visible. This period corresponds to the fast formation of the bar in the disk. After ≈1−1.5 Gyr, Δμmax grows continuously, but at lower rates. This period corresponds to the secular evolution period of the bar (see Fig. 1). Figure 4 shows that for the GALAKOS simulation, higher Δμmax values are expected for more evolved bars. Nevertheless, the time is not the only parameter determining the value of Δμmax.
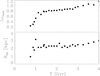 |
Fig. 4. Time evolution of Δμmax (upper panel) and RDG (lower panel) for the GALAKOS simulation. |
The growth of the bar is determined by the number of angular momentum exchanges between the bar and other components of the galaxy, such as the halo (see Athanassoula 2003; Debattista & Sellwood 2000; Athanassoula et al. 2013). Bars that have exchanged more angular momentum are larger and stronger than those with only a few exchanges. The GALAKOS simulation has no gaseous disk, and it shows that after 4 Gyr of evolution, a long and strong bar has appeared in the disk of the simulated galaxy. This strong non-axymmetric component implies that there must have been an essential redistribution of the angular momentum in the galaxy. This is reflected in the slowdown experienced by the bar during the simulation. At 1.5 Gyr from the beginning of the simulation, the pattern speed of the bar was Ωb = 55 km s−1 kpc−1. At the end of the simulation, the pattern speed was Ωb = 30 km s−1 kpc−1. It is expected that strong bars produce large deficits of light between the bar and the interbar profiles. Then, the high Δμmax value shown by the simulated galaxy at 4 Gyr is due to the strong and large bar in the disk that has grown by exchanging angular momentum. This indicates that high values of Δμmax in general reflect the presence of strong bars that have exchanged angular momentum during their formation and evolution. In addition, galaxies with high values of Δμmax should be dynamically evolved bars. In contrast, low values of Δμmax are expected in weak bars. This type of bar can be weak for several billion years. The only reason for these systems not to grow is that they exchange some angular momentum with the galaxy (Athanassoula 2002; Cuomo et al. 2019a). Therefore, low values of Δμmax are not necessarily associated with the early stage of the bar evolution, but they might be a consequence of a small exchange of angular momentum between the bar and other galactic components during its evolutionary history. In summary, the amount of the redistribution of the angular momentum in the galaxy could determine the value of Δμmax.
Figure 3 also shows that (RDG) is always located within the bar region, that is, Rb/RDG > 1.0. In particular, the ratio Rb/RDG is about 1.5 at all times, varying from a minimum of 1.2 and a maximum of 1.9. This implies that the DG is not related to the corotation resonance (CR) as proposed by Buta (2017) for a sample of barred galaxies with ring and pseudo-ring morphologies. The x1 orbits forming the bar are stable within the CR. According to orbital theory, Rb/RCR should therefore be smaller than 1.0 (Athanassoula 2002). If the location of the DG coincides with the CR, as proposed by Buta (2017), then for the GALAKOS simulated galaxy, Rb/RCR > 1.0, which contradicts the findings of orbital theory.
3. Real barred galaxies
We selected a sample of 37 galaxies from Aguerri et al. (2003, 2015) and Cuomo et al. (2019a,b) to analyze the properties of their DGs. We are especially interested in analyzing the relation between RDG and the dynamics of the bars provided by their pattern speeds. For all these real galaxies, we obtained the bar radius, strength, and bar pattern speed with the same method. This sample of galaxies constitutes a set of objects for which the three main parameters of the bars are homogeneously determined. All galaxies in the sample were studied by using the Fourier analysis of their azimuthal luminosity profiles (Aguerri et al. 2000). This analysis allowed us to obtain the bar radius (Rb) and the bar strength (Sb). The bar radius was obtained using the method described in Aguerri et al. (2000). The bar strength was obtained as the peak of the m = 2 Fourier mode of each galaxy.
The bar pattern speed (Ωb) was obtained for all galaxies in the sample by applying the model-independent TW method. We also obtained the corotation radius RCR from the ratio Vc/Ωb, where Vc is the circular velocity of the galaxies. This allowed us to infer the rotation rate R = RCR/Rb.
3.1. Dark gaps and resonances
We calculated the values of Δμmax and RDG for all galaxies. Figure 5 shows the ratio Rb/RDG for the galaxies of the sample. For comparison, w also plot this ratio for the GALAKOS simulation. As we mentioned before, the ratio Rb/RDG for the simulation is always higher than 1.2 and shows a large peak at 1.5. Nevertheless, the values of the ratios Rb/RDG for the observed galaxies are spread more widely. A fraction of 11% of real galaxies shows Rb/RDG < 1.
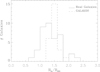 |
Fig. 5. Ratio of Rb and RDG for real barred galaxies (full histogram) and for the GALAKOS simulation (dashed histogram). |
We divided the galaxies into two samples according to their Rb/RDG ratio. We used the value Rb/RDG = 1.2 as the boundary for the division. This limit was imposed based on the values obtained from the GALAKOS simulation (Rb/RDG > 1.2). This division allowed us to split the real galaxies into two sets: those more similar to the GALAKOS simulation in terms of the quantity Rb/RDG, and those that are more different. There is no a physical reason for this split. The location of the galaxies in the plane Rb/RDG versus RCR/RDG is continuous. Figure 6 shows the ratios RCR/RDG for the two set of galaxies. Galaxies with Rb/RDG < 1.2 show ratios RCR/RDG that peak around 1.0. This might indicate that RDG and RCR are linked for these galaxies. In contrast, in galaxies with Rb/RDG > 1.2, RCR is higher than RDG. In particular, these galaxies show that the peak of RCR/RDG is at about 1.8. For a flat rotation curve, the ratio of the CR and UHR is RCR/RUHR ∼ 1.8 (Athanassoula et al. 1982). In this case, the DG would be related to the UHR as proposed by (Krishnarao et al. 2022).
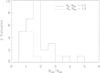 |
Fig. 6. Ratio ofRCR and RDG for real barred galaxies split into two groups according to their Rb/RDG values. |
These results might indicate that the DGs observed for galaxies with Rb/RDG > 1.2 are similar to the galaxy analyzed in the GALAKOS simulation and might be related to the trapping of stars as a result of the bar growth. In this case, the DG can be used as a tracer of the UHR, as proposed by Krishnarao et al. (2022). In contrast, the DGs observed in galaxies with Rb/RDG < 1.2 might be produced by different mechanisms and might trace the CR resonance of the galaxy, as proposed by Buta (2017).
3.2. Location of galaxies in the RCR/h − Rb/h plane
We located the galaxies in the plane defined by Rcr/h − Rb/h, where h is the scale length of the disks. We obtained this scale length by fitting the external regions (R > Rb) of the azimuthal average intensity profiles of the galaxies with an exponential law. Slow (RCR/Rb > 1.4) and fast (RCR/Rb < 1.4) bars are located in different parts of this plane. We colored the symbols corresponding to the real galaxies according to their Δμmax values. Galaxies with different values of Δμmax are located in different regions of this plane. In particular, galaxies for which RCR/h and Rb/h is smaller than one also show low values of Δμmax. Thus, the mean value of Δμmax for these galaxies is ⟨Δμmax⟩=0.31. Galaxies showing values of RCR/h > 1.5 and Rb/h > 1.5 show higher Δμmax values. These galaxies show ⟨Δμmax⟩=0.51. This agrees with the results obtained by Kim et al. (2016). They also found that larger bars show higher values of Δμmax.
In the GALAKOS bar, the evolution of the value of Δμmax is related to the galaxy evolution, that is, higher values of Δμmax were measured in late times in the bar evolution. This means that galaxies in which the corotation and bar radius is located in the inner regions of the disk have exchanged a small amount of angular momentum. In contrast, galaxies in which RCR and Rb is located at a radius larger than the scale length of the disks have exchanged a more significant amount of angular momentum. Therefore, the plot RCR/h vs. Rb/h could indicate the bar evolution or the amount of angular momentum exchanged by the bar and other galaxy components.
We also overplot in Fig. 7 the values of RCR/h and Rb/h for the GALAKOS simulation, color-coded by their Δμmax values. The GALAKOS bar can be classified as fast at the beginning of its evolution. At this epoch, the value of Δμmax is lower than ≈0.6. As the bar evolves, the galaxy shows higher values of Δμmax, and the bar has been transformed into a slow rotator by the large amount of angular momentum lost by the disk. At this time, Δμmax is larger than 0.9. Figure 8 shows the values of RCR/Rb as a function of Δμmax for real galaxies and for the GALAKOS galaxy. The value of the ratio RCR/Rb classifies bars into slow (RCR/Rb > 1.4) and fast (RCR/Rb < 1.4) rotators. All bars in real galaxies are compatible with being fast rotators and show values of Δμmax lower than 0.8. The GALAKOS simulation becomes a slow rotator, in which Δμmax is larger than 0.8. This might indicate that the value of Δμmax could indicate whether bars are fast or slow rotators.
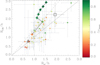 |
Fig. 7. RCR/h vs. Rb/h for the galaxies with TW measurements (colored circles), MW long-bar model (open square), MW short-bar model (open triangle), and simulated galaxy (colored stars). The symbols are colored according to the values of their Δμmax. The two models of the MW are represented by an open triangle (short bar) and an open square (long bar). The full diagonal and the dashed lines represent galaxies with Rcr/Rb = 1.0 and 1.4, respectively. |
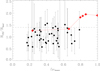 |
Fig. 8. RCR/Rb vs. Δμmax for the galaxies with TW measurements (filled circles) and the simulated GALAKOS galaxy (red stars). The dashed horizontal line separates slow (Rcr/Rb > 1.4) and fast (Rcr/Rb < 1.4) bars. |
4. Discussion
We have analyzed the bar growth in a simulated MW-like galaxy. The obtained long and strong bar produces a redistribution of the phase-space of the disk and structural changes in the inner parts of the disk. In particular, the bar produces a light deficit between the bar and interbar intensity profiles. The amplitude of this deficit is related to the amount of angular momentum that is exchanged between the bar and other galaxy components. We discuss several points for which determining this light deficit in real galaxies would be helpful.
4.1. Flat and exponential bars
Elmegreen & Elmegreen (1985) analyzed the properties of bars and divided the barred galaxies into two types according to their surface brightness profiles: exponential, and flat. Exponential bars are those for which the bar is not visible in the luminosity profiles. In these cases, the surface brightness profile of the bar is an exponential similar to the disk. In contrast, the surface brightness profiles of flat bars are very different from the disk. In particular, the surface brightness profiles of flat bars are flatter than the disk and can be seen clearly above the exponential surface brightness disk profile. We have obtained the values of Δμmax for galaxies with r-band images from the SDSS that Elmegreen & Elmegreen (1985) classified as flat and exponential. Figure 9 shows the Δμmax values for these galaxies. The two cumulative distributions are different. Exponential bars show a mean Δμmax value of 0.32, while flat bars have 0.57. In addition, all galaxies with Δμmax < 0.3 were classified as exponential ones by Elmegreen & Elmegreen (1985), and all galaxies with Δμmax > 0.65 were classified as flat ones. This means that Δμmax can be used to classify bars of the galaxies into exponential and flat objects.
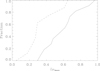 |
Fig. 9. Cumulative distribution function of Δμmax for galaxies classified as exponential bars (dashed line) and flat bars (full line) in Elmegreen & Elmegreen (1985). |
The link between the value of Δμmax and the exchange of angular momentum of the bar and other galactic components allows us to infer that exponential bars are those that have exchanged little angular momentum and have not grown. In contrast, flat bars are those with a significant angular momentum exchange.
4.2. Selection of slow-bar candidates
Bars are classified according to their rotation rate (R = RCR/Rb) into fast and slow bars. Fast rotators are bars that end almost at the corotation radius (1.0 < R < 1.4). In contrast, slow bars are those in which corotation is located farther out from the bar radius (R > 1.4). Many fast bars have been measured in the literature. Nevertheless, the number of slow bars is small. We can mention the low surface brightness galaxy UGC 628 or the dwarf NGC 4277 as two clearer examples of slow bars (Chequers et al. 2016; Buttitta et al. 2022).
Numerical simulations show that the bar formation and evolution is a complex process that depends on different galaxy parameters such as gas content, concentration, and shape of the dark matter halo or velocity dispersion of the stars in the disk (see, e.g., Athanassoula 2003; Athanassoula et al. 2013; Debattista & Sellwood 2000). These simulations indicate that slow bars are a natural consequence of the redistribution of the angular momentum in the galaxies that arise from the evolution of the bar. In this context, slow bars should exist and be more dynamically evolved than fast ones. The Δμmax parameter defined in the present work could be helpful in order to select galaxies that have exchanged a large amount of angular momentum between the bar and other components of the galaxies. These objects with Δμmax > 0.8 would be the best candidates for slow bars. According to Fig. 7, no galaxies with Δμmax > 0.8 have been included in the samples available in the literature with measurements of Ωb by the TW method. In the future, it would be interesting to explore the possibility of measuring the bar pattern speed in a sample of galaxies with large Δμmax > 0.8. These galaxies would be the best candidates for slow-bar rotators.
The bar of the GALAKOS simulation shows higher values of Δμmax than real bars. This might also be related with the differences between the simulations and the real galaxies. In particular, the GALAKOS simulation lacks gas or star formation. The presence of gas and star formation in galaxies might affect the values of Δμmax. In this context, gas-rich galaxies could have DGs with lower values of Δμmax than gas-poor galaxies. The reason might be the formation of new stars in the disk, which would make the DGs less prominent. Recent hydrodynamical simulations of bars have shown that the inclusion of initial gas fractions over 5% cause the formed bars to be fast during a long time period of their evolution (see Beane et al. 2022). Beane and colleagues proposed that the interaction between the gas phase of the disk and the dark matter halo prevents the slowing down of the formed bar. This might explain the fact that in Fig. 7, the bars of the real galaxies are always fast. In contrast, the GALAKOS bar reaches the slow regime. The evolution of the DG parameters in the context of simulations with gas needs to be determined. Independently of the absolute value of Δμmax, the relation between the position of the galaxy in the Rb/h − Rcr/h plane and the Δμmax value is quite strong.
4.3. Milky Way bar
Our Galaxy is barred. There is a considerable consensus in the literature about this. Nevertheless, the debate about the type of bar hosted in the disk of the MW is still ongoing (see Bland-Hawthorn & Gerhard 2016). In particular, two main models support some of the observational pieces of evidence. One model assumes that the MW bar is short, with a length of about 3 kpc (Dehnen 2000; Fragkoudi et al. 2019). In contrast, other models argued that the bar is long, with a radius of about 5 kpc (Pérez-Villegas et al. 2017; Portail et al. 2017).
The dynamical implications of the two models are very different. Thus, if the bar is short, then the outer Lindblad resonance (OLR) is located near the Sun. This has several implications for the explanation of the stellar dynamics in the solar vicinity. On the other hand, if the bar is long, then the OLR of the Galaxy is far away from the Sun. For this model, the CR is located at a radius of ≈6 kpc close to the Sun radius. These two resonances are cited most frequently to explain the kinematics of stars in the solar vicinity, and in particular, the so-called Hercules stream (Dehnen 2000; Pérez-Villegas et al. 2017; Fragkoudi et al. 2019; D’Onghia & Aguerri 2020).
We have located the two bar models of the MW in the RCR/h − Rb/h plane shown in Fig. 7. The two models locate the MW in very different regions of this plane. In particular, the long-bar model implies that the MW is located in the region of the plane with high Rb/h and RCR/h values. We have discussed before that the galaxies occupy this plane region with dynamically evolved bars that have exchanged a large amount of angular momentum. In contrast, the model of a short bar of the MW would locate the Galaxy in the region with low values of RCR/h and Rb/h. These galaxies occupy this plane position with a small exchange of angular momentum. One way to advance this discussion might be to directly measure the value of Δμmax for the MW. Thus, values of Δμmax higher than 0.4 would favor a bar with a large exchange of angular momentum, that is, a long bar. In contrast, values of Δμmax lower than 0.4 would favor a bar model with a small exchange of angular momentum, that is, a short bar.
The location of the DG in the MW could be determined by using near-infrared surveys such as Two Micron Galactic Survey (TMGS, Garzon et al. 1993), Telescopio Carlos Sánchez – CAmara INfrarroja (TCS-CAIN, Cabrera-Lavers et al. 2006), Galactic Legacy Infrared Mid-Plane Survey Extraordinaire (GLIMPSE, Benjamin et al. 2003), or UKIRT Infrared Deep Sky Survey (IKIDSS, Lawrence et al. 2007). These surveys have been used in the past to study the inner and outer structure of the disk of the MW by the detection of the red clump giant population. These stars are excellent distance indicators and have been used to infer the disk scale length (López-Corredoira et al. 2002, 2004) or the length of the galactic bar (Cabrera-Lavers et al. 2018). This type of survey could be used to determine the profiles along the bar major and minor axis and to determine the location of the DG of the Galaxy. The location of the DG in the MW could determine the position of the UHR and infer the CR. In addition, some modeling or calibration with MW-like simulations could be used to infer the strength of the DG in the MW. These data would be used as an indirect measurement of the type of bar in the MW.
5. Conclusion
We have investigated the effects produced in the disk phase-space by growing a nonaxisymmetric bar feature. Taking advantage of the GALAKOS simulation, we analyzed the growth of a strong and long bar in a galaxy with similar parameters to the MW. We analyzed the evolution of the so-called DGs, a deficit of light in the direction of the bar minor axis compared to the major axis. We obtained the radius at which the DG is located (RDG) and its prominence (Δμmax). Both quantities evolve with time in the GALAKOS simulation. Thus, DGs are located at a larger radius and are more prominent as the bar grows. At all times of the simulation, Rb/RDG > 1.2. this means that the DG is located within the bar radius. There is also a clear relation between Δμmax and the slow-down of the bar of the simulated galaxy. This indicates that the DG prominence might be related to the angular momentum exchange between the bar and other galactic components.
We selected a sample of 37 barred galaxies from the literature. For these galaxies, homogeneous measurements of their bar radii, strengths, and pattern speeds are available. We computed RDG and Δμmax for the DGs of these galaxies. For ≈90% of the galaxies, Rb/RDG > 1.2 as in the GALAKOS galaxy. For these objects, the distribution of RCR/RDG peaks at about 1.8. This value is similar to the ratio RCR/RUHR, which indicates that the DG might be related to the UHR of the Galaxy, as proposed by Krishnarao et al. (2022). The remaining 10% of the galaxies shows Rb/RDG < 1.2, and the distribution of RCR/RDG peaks at about 1.0. This indicates that these DGs are associated with the Galaxy CR and that they are different from those measured in the simulations.
The galaxies are located in the RCR/h − Rb/h plane in different locations according to their values of Δμmax. In particular, galaxies with low values of Δμmax show RCR and Rb smaller or similar to the scale length of the disks in which they reside. In contrast, galaxies with high values of Δμmax show a bar radius and corotation larger than the scale length of the disk. Moreover, the position in the RCR/h − Rb/h plane of the simulated bar of the GALAKOS simulation also depends on its value of Δμmax. In particular, the simulated bar becomes a slow rotator when Δμmax > 0.8. This characteristic suggests that the position of the galaxies in the RCR/h − Rb/h plane and their values of Δμmax might indicate the dynamical status of the bar.
Acknowledgments
The research of JALA has been supported by the Spanish Ministry of Ciencia e Innovación under the grant PID2020-119342GB-I00. V.C. is supported by the Chilean Fondecyt Postdoctoral programme 2022 No. 3220206.
References
- Aguerri, J. A. L., Muñoz-Tuñón, C., Varela, A. M., et al. 2000, A&A, 361, 841 [NASA ADS] [Google Scholar]
- Aguerri, J. A. L., Balcells, M., & Peletier, R. F. 2001, A&A, 367, 428 [NASA ADS] [CrossRef] [EDP Sciences] [Google Scholar]
- Aguerri, J. A. L., Debattista, V. P., & Corsini, E. M. 2003, MNRAS, 338, 465 [NASA ADS] [CrossRef] [Google Scholar]
- Aguerri, J. A. L., Iglesias-Paramo, J., Vilchez, J. M., et al. 2004, AJ, 127, 1344 [NASA ADS] [CrossRef] [Google Scholar]
- Aguerri, J. A. L., Méndez-Abreu, J., & Corsini, E. M. 2009, A&A, 495, 491 [NASA ADS] [CrossRef] [EDP Sciences] [Google Scholar]
- Aguerri, J. A. L., Méndez-Abreu, J., Falcón-Barroso, J., et al. 2015, A&A, 576, A102 [NASA ADS] [CrossRef] [EDP Sciences] [Google Scholar]
- Athanassoula, E. 2002, ApJ, 569, L83 [NASA ADS] [CrossRef] [Google Scholar]
- Athanassoula, E. 2003, MNRAS, 341, 1179 [Google Scholar]
- Athanassoula, E., Bosma, A., Creze, M., et al. 1982, A&A, 107, 101 [NASA ADS] [Google Scholar]
- Athanassoula, E., Machado, R. E. G., & Rodionov, S. A. 2013, MNRAS, 429, 1949 [Google Scholar]
- Barden, M., Rix, H.-W., Somerville, R. S., et al. 2005, ApJ, 635, 959 [NASA ADS] [CrossRef] [Google Scholar]
- Beane, A., Hernquist, L., D’Onghia, E., et al. 2022, MNRAS, submitted [arXiv:2209.03364] [Google Scholar]
- Benjamin, R. A., Churchwell, E., Babler, B. L., et al. 2003, PASP, 115, 953 [Google Scholar]
- Bland-Hawthorn, J., & Gerhard, O. 2016, ARA&A, 54, 529 [Google Scholar]
- Blanton, M. R., Bershady, M. A., Abolfathi, B., et al. 2017, AJ, 154, 28 [Google Scholar]
- Bundy, K., Bershady, M. A., Law, D. R., et al. 2015, ApJ, 798, 7 [Google Scholar]
- Buta, R. J. 2017, MNRAS, 470, 3819 [Google Scholar]
- Buta, R. J., & Zhang, X. 2009, ApJS, 182, 559 [Google Scholar]
- Buta, R., Laurikainen, E., Salo, H., et al. 2010, ApJ, 721, 259 [NASA ADS] [CrossRef] [Google Scholar]
- Buta, R. J., Sheth, K., Athanassoula, E., et al. 2015, ApJS, 217, 32 [Google Scholar]
- Buttitta, C., Corsini, E. M., Cuomo, V., et al. 2022, A&A, 664, L10 [NASA ADS] [CrossRef] [EDP Sciences] [Google Scholar]
- Cabrera-Lavers, A., Garzón, F., Hammersley, P. L., et al. 2006, A&A, 453, 371 [NASA ADS] [CrossRef] [EDP Sciences] [Google Scholar]
- Canzian, B. 1993, ApJ, 414, 487 [NASA ADS] [CrossRef] [Google Scholar]
- Cepa, J., & Beckman, J. E. 1990, A&A, 239, 85 [NASA ADS] [Google Scholar]
- Chequers, M. H., Spekkens, K., Widrow, L. M., et al. 2016, MNRAS, 463, 1751 [NASA ADS] [CrossRef] [Google Scholar]
- Cuomo, V., Lopez Aguerri, J. A., Corsini, E. M., et al. 2019a, A&A, 632, A51 [NASA ADS] [CrossRef] [EDP Sciences] [Google Scholar]
- Cuomo, V., Corsini, E. M., Aguerri, J. A. L., et al. 2019b, MNRAS, 516, L24 [Google Scholar]
- Debattista, V. P., & Sellwood, J. A. 2000, ApJ, 543, 704 [Google Scholar]
- Debattista, V. P., Mayer, L., Carollo, C. M., et al. 2006, ApJ, 645, 209 [Google Scholar]
- Dehnen, W. 2000, AJ, 119, 800 [NASA ADS] [CrossRef] [Google Scholar]
- Díaz-García, S., Salo, H., Laurikainen, E., et al. 2016, A&A, 587, A160 [NASA ADS] [CrossRef] [EDP Sciences] [Google Scholar]
- D’Onghia, E. L., & Aguerri, J. A. 2020, ApJ, 890, 117 [CrossRef] [Google Scholar]
- Eliche-Moral, M. C., Balcells, M., Aguerri, J. A. L., et al. 2006, A&A, 457, 91 [NASA ADS] [CrossRef] [EDP Sciences] [Google Scholar]
- Elmegreen, B. G., & Elmegreen, D. M. 1985, ApJ, 288, 438 [Google Scholar]
- Font, J., Beckman, J. E., Epinat, B., et al. 2011, ApJ, 741, L14 [Google Scholar]
- Fragkoudi, F., Katz, D., Trick, W., et al. 2019, MNRAS, 488, 3324 [NASA ADS] [Google Scholar]
- Garzon, F., Hammersley, P. L., Mahoney, T., et al. 1993, MNRAS, 264, 773 [CrossRef] [Google Scholar]
- Gutiérrez, C. M., Trujillo, I., Aguerri, J. A. L., et al. 2004, ApJ, 602, 664 [CrossRef] [Google Scholar]
- Laurikainen, E., Salo, H., Buta, R., et al. 2007, MNRAS, 381, 401 [NASA ADS] [CrossRef] [Google Scholar]
- Hernquist, L. 1990, ApJ, 356, 359 [Google Scholar]
- Kim, T., Gadotti, D. A., Athanassoula, E., et al. 2016, MNRAS, 462, 3430 [Google Scholar]
- Knapen, J. H., Shlosman, I., & Peletier, R. F. 2000, ApJ, 529, 93 [NASA ADS] [CrossRef] [Google Scholar]
- Krishnarao, D., Pace, Z. J., D’Onghia, E., et al. 2022, ApJ, 929, 112 [NASA ADS] [CrossRef] [Google Scholar]
- Laurikainen, E., & Salo, H. 2002, MNRAS, 337, 1118 [Google Scholar]
- Lawrence, A., Warren, S. J., Almaini, O., et al. 2007, MNRAS, 379, 1599 [Google Scholar]
- Lee, Y. H., Park, M.-G., Ann, H. B., et al. 2020, ApJ, 899, 84 [NASA ADS] [CrossRef] [Google Scholar]
- Lilly, S., Schade, D., Ellis, R., et al. 1998, ApJ, 500, 75 [NASA ADS] [CrossRef] [Google Scholar]
- Łokas, E. L. 2018, ApJ, 857, 6 [Google Scholar]
- Łokas, E. L. 2021, A&A, 655, A97 [NASA ADS] [CrossRef] [EDP Sciences] [Google Scholar]
- López-Corredoira, M., Cabrera-Lavers, A., Garz{\’o}n, F., et al. 2002, A&A, 394, 883 [NASA ADS] [CrossRef] [EDP Sciences] [Google Scholar]
- López-Corredoira, M., Cabrera-Lavers, A., Gerhard, O. E., et al. 2004, A&A, 421, 953 [NASA ADS] [CrossRef] [EDP Sciences] [Google Scholar]
- Martinez-Valpuesta, I., Aguerri, J. A. L., González-García, A. C., et al. 2017, MNRAS, 464, 1502 [NASA ADS] [CrossRef] [Google Scholar]
- Masters, K. L., Nichol, R. C., Hoyle, B., et al. 2011, MNRAS, 411, 2026 [Google Scholar]
- Méndez-Abreu, J., Sánchez-Janssen, R., Aguerri, J. A. L., et al. 2012, ApJ, 761, L6 [CrossRef] [Google Scholar]
- Minchev, I., & Famaey, B. 2010, ApJ, 722, 112 [Google Scholar]
- Möllenhoff, C., & Heidt, J. 2001, A&A, 368, 16 [NASA ADS] [CrossRef] [EDP Sciences] [Google Scholar]
- Nair, P. B., & Abraham, R. G. 2010, ApJ, 714, L260 [Google Scholar]
- Ohta, K., Hamabe, M., & Wakamatsu, K.-I. 1990, ApJ, 357, 71 [Google Scholar]
- Pérez-Villegas, A., Portail, M., Wegg, C., et al. 2017, ApJ, 840, L2 [CrossRef] [Google Scholar]
- Portail, M., Gerhard, O., Wegg, C., et al. 2017, MNRAS, 465, 1621 [NASA ADS] [CrossRef] [Google Scholar]
- Puerari, I., & Dottori, H. 1997, ApJ, 476, L73 [Google Scholar]
- Quillen, A. C., Frogel, J. A., & Gonzalez, R. A. 1994, ApJ, 437, 162 [Google Scholar]
- Sanchez-Janssen, R., & Gadotti, D. A. 2013, MNRAS, 432, L56 [NASA ADS] [CrossRef] [Google Scholar]
- Sheth, K., Elmegreen, D. M., Elmegreen, B. G., et al. 2008, ApJ, 675, 1141 [Google Scholar]
- Simard, L., Koo, D. C., Faber, S. M., et al. 1999, ApJ, 519, 563 [NASA ADS] [CrossRef] [Google Scholar]
- Springel, V. 2005, MNRAS, 364, 1105 [Google Scholar]
- Toomre, A. 1964, ApJ, 139, 1217 [Google Scholar]
- Tremaine, S., & Weinberg, M. D. 1984, ApJ, 282, L5 [Google Scholar]
- Vera-Ciro, C., D’Onghia, E., Navarro, J., & Abadi, M. 2014, ApJ, 794, 173 [NASA ADS] [CrossRef] [Google Scholar]
- Vera-Ciro, C., D’Onghia, E., & Navarro, J. 2016, ApJ, 833, 42 [NASA ADS] [CrossRef] [Google Scholar]
- Valenzuela, O., & Klypin, A. 2003, MNRAS, 345, 406 [Google Scholar]
- Weinzirl, T., Jogee, S., Khochfar, S., et al. 2009, ApJ, 696, 411 [NASA ADS] [CrossRef] [Google Scholar]
- Wozniak, H., Friedli, D., Martinet, L., et al. 1995, A&AS, 111, 115 [NASA ADS] [Google Scholar]
All Figures
|
Fig. 1. Time evolution of the bar parameters of the GALAKOS simulation: strength (upper panel), length (middle panel), and pattern speed (lower panel). |
| In the text | |
|
Fig. 2. Time evolution of the disk scale length of the simulated galaxy. |
| In the text | |
|
Fig. 3. Azimuthal average surface density profile (small points), bar profile (full line), and interbar profile (dashed line) at four different time steps of the simulations. The vertical line represents the bar radius for each of the snapshots. |
| In the text | |
|
Fig. 4. Time evolution of Δμmax (upper panel) and RDG (lower panel) for the GALAKOS simulation. |
| In the text | |
|
Fig. 5. Ratio of Rb and RDG for real barred galaxies (full histogram) and for the GALAKOS simulation (dashed histogram). |
| In the text | |
|
Fig. 6. Ratio ofRCR and RDG for real barred galaxies split into two groups according to their Rb/RDG values. |
| In the text | |
|
Fig. 7. RCR/h vs. Rb/h for the galaxies with TW measurements (colored circles), MW long-bar model (open square), MW short-bar model (open triangle), and simulated galaxy (colored stars). The symbols are colored according to the values of their Δμmax. The two models of the MW are represented by an open triangle (short bar) and an open square (long bar). The full diagonal and the dashed lines represent galaxies with Rcr/Rb = 1.0 and 1.4, respectively. |
| In the text | |
|
Fig. 8. RCR/Rb vs. Δμmax for the galaxies with TW measurements (filled circles) and the simulated GALAKOS galaxy (red stars). The dashed horizontal line separates slow (Rcr/Rb > 1.4) and fast (Rcr/Rb < 1.4) bars. |
| In the text | |
|
Fig. 9. Cumulative distribution function of Δμmax for galaxies classified as exponential bars (dashed line) and flat bars (full line) in Elmegreen & Elmegreen (1985). |
| In the text | |
Current usage metrics show cumulative count of Article Views (full-text article views including HTML views, PDF and ePub downloads, according to the available data) and Abstracts Views on Vision4Press platform.
Data correspond to usage on the plateform after 2015. The current usage metrics is available 48-96 hours after online publication and is updated daily on week days.
Initial download of the metrics may take a while.