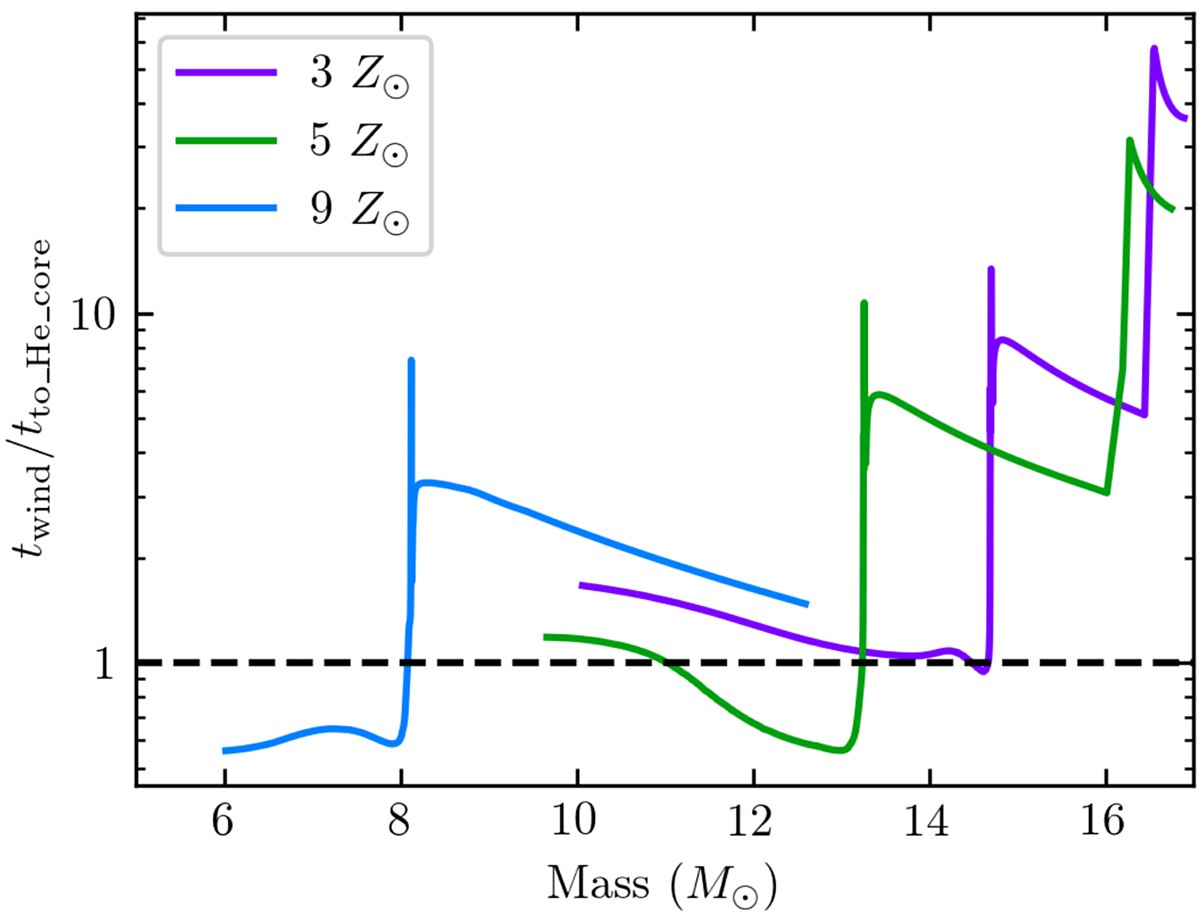
Fig. 4.
Download original image
Wind-lifetime ratio vs. mass of a 17 M⊙ star at different metallicities. The axes are the same as those in Fig. 1 and the right panel of Fig. 2. This plot combines the 17 M⊙ tracks previously shown in Fig. 1 (at 5 Z⊙ and 9 Z⊙) with the 3 Z⊙ model. The crossover masses decrease with increasing metallicity (see text). The first 2 million years of evolution have been excluded for plot clarity.
Current usage metrics show cumulative count of Article Views (full-text article views including HTML views, PDF and ePub downloads, according to the available data) and Abstracts Views on Vision4Press platform.
Data correspond to usage on the plateform after 2015. The current usage metrics is available 48-96 hours after online publication and is updated daily on week days.
Initial download of the metrics may take a while.