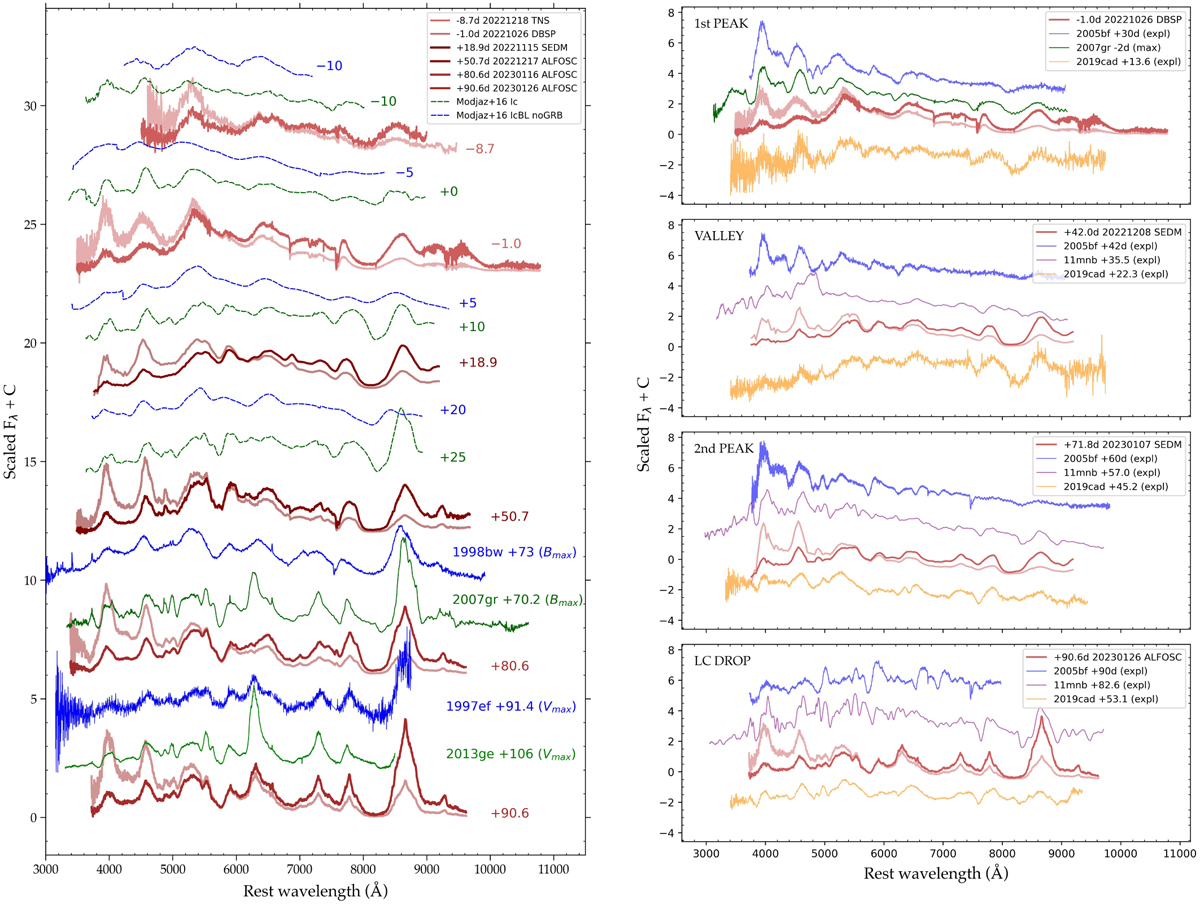
Fig. A.2
Download original image
(Left panel) Spectral comparison of SN 2022xxf to SN Ic (dashed green lines) and GRB-less SN IcBL (dashed blue lines) templates (Modjaz et al. 2016), and other SNe after +50 days not covered by the templates. The template spectra are flattened, and thus do not represent the correct SED shape - the comparison is intended for identifying similar spectral features. Well-observed Type Ic SNe 2007gr (Hunter et al. 2009, spectrum from Shivvers et al. 2019) and 2013ge (Drout et al. 2016) are plotted in solid green lines, and SNe IcBL 1998bw (Patat et al. 2001) and 1997ef (Modjaz et al. 2014) are plotted in solid blue lines. Spectra of SN 2022xxf are plotted in reddish colors, with the dereddened ones in lighter shades. Phases are in days relative to the first peak of the light curve. (Rightpanels) Spectral comparison of SN 2022xxf with other two-humped objects, during specific LC phases: around the first peak, the ‘valley’ between the peaks, around the second peak, and the fall after the second peak. The LC-peak spectrum of SN 2007gr is shown in the first panel for comparison.
Current usage metrics show cumulative count of Article Views (full-text article views including HTML views, PDF and ePub downloads, according to the available data) and Abstracts Views on Vision4Press platform.
Data correspond to usage on the plateform after 2015. The current usage metrics is available 48-96 hours after online publication and is updated daily on week days.
Initial download of the metrics may take a while.