Fig. A.1
Download original image
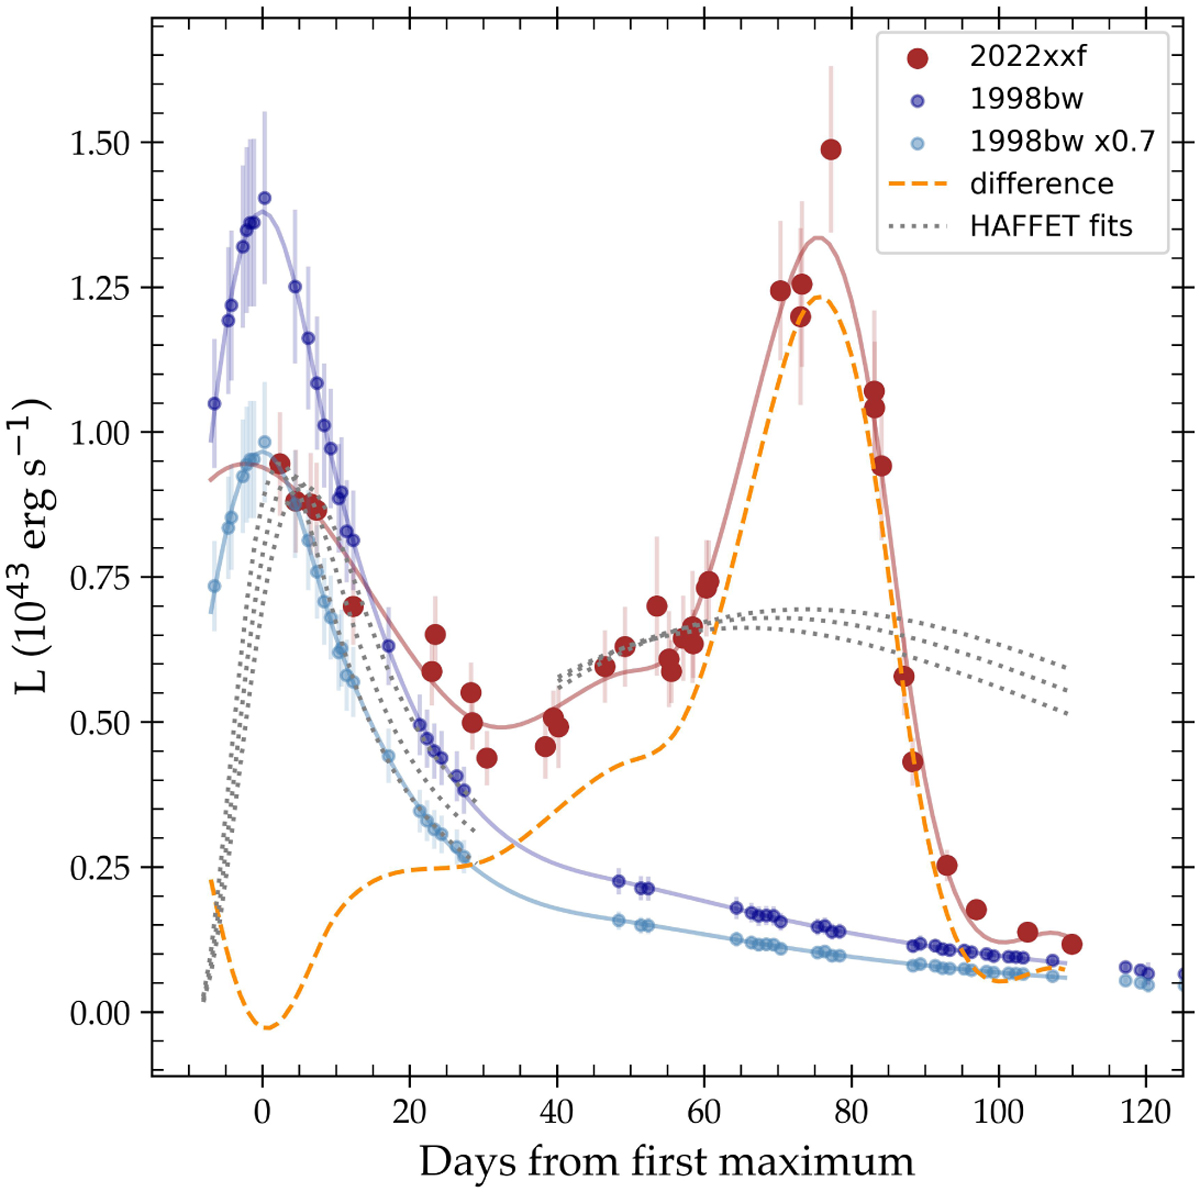
Bolometric light curves of SN 2022xxf (red points) and SN 1998bw (Patat et al. 2001; Clocchiatti et al. 2011) (blue points; light blue for the scaled-down LC). Solid lines are spline representations of the LCs. The difference between the LC of SN 2022xxf and the scaled-down LC of SN 1998bw is plotted with a dashed orange line. The dotted gray lines indicate 56Ni fits using HAFFET.
Current usage metrics show cumulative count of Article Views (full-text article views including HTML views, PDF and ePub downloads, according to the available data) and Abstracts Views on Vision4Press platform.
Data correspond to usage on the plateform after 2015. The current usage metrics is available 48-96 hours after online publication and is updated daily on week days.
Initial download of the metrics may take a while.