Fig. 6
Download original image
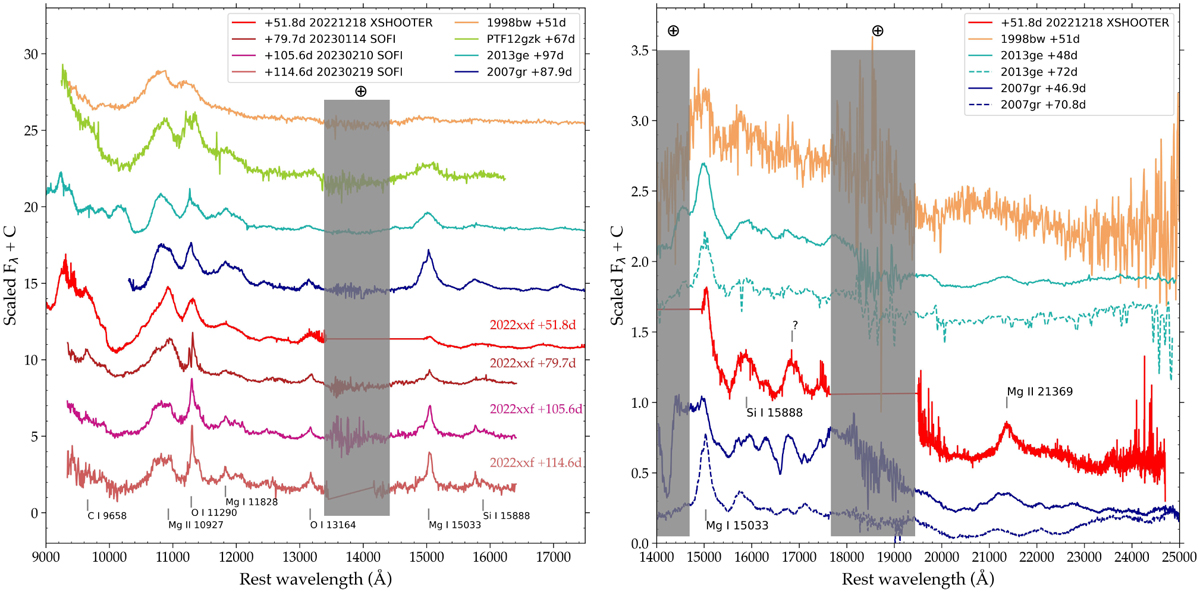
NIR spectra of SN 2022xxf in the JH (left panel) and HK bands (right panel), compared to those of SN IcBL l998bw (Patat et al. 2001) and SNe Ic PTF12gzk (Horesh et al. 2013; spectrum from PESSTO Data Release 1, Smartt et al. 2015), 2013ge (Drout et al. 2016), 2007gr (Hunter et al. 2009). Prominent emission lines are indicated by vertical lines corresponding to the rest wavelengths. Vertical gray shades indicate spectral regions affected by telluric absorption.
Current usage metrics show cumulative count of Article Views (full-text article views including HTML views, PDF and ePub downloads, according to the available data) and Abstracts Views on Vision4Press platform.
Data correspond to usage on the plateform after 2015. The current usage metrics is available 48-96 hours after online publication and is updated daily on week days.
Initial download of the metrics may take a while.