Fig. 3
Download original image
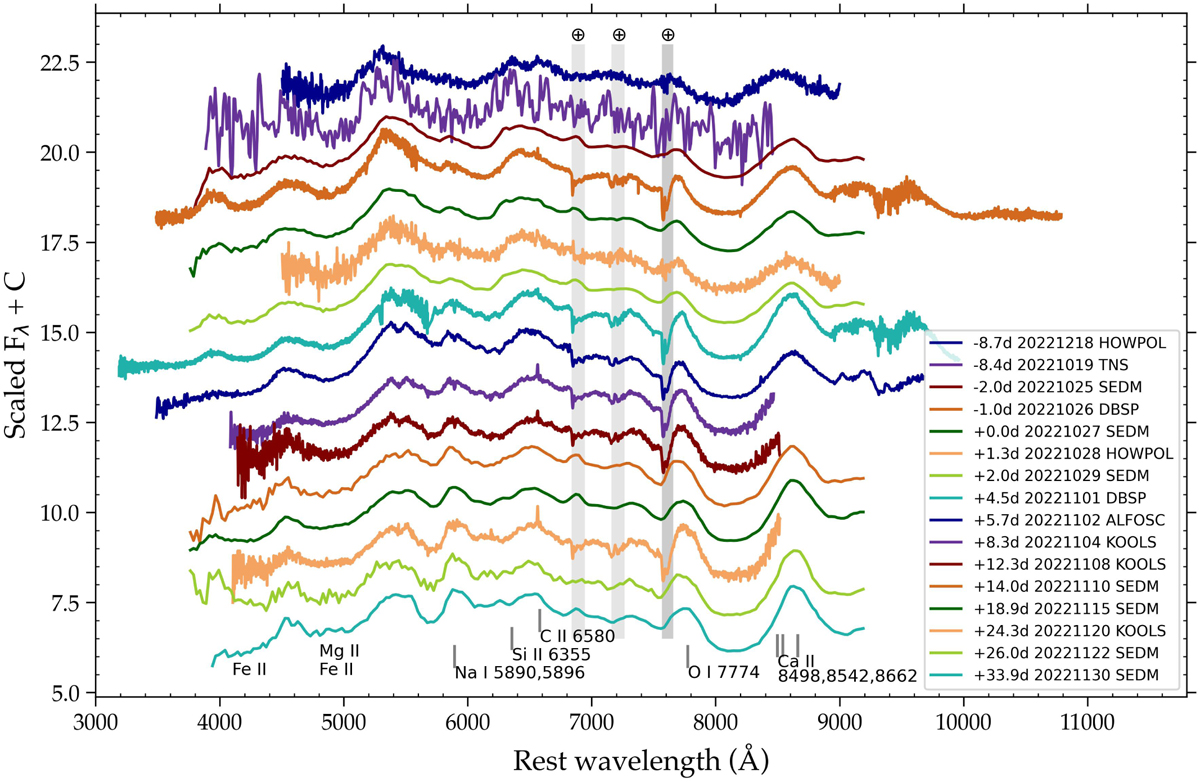
Spectral sequence of SN 2022xxf during the first LC hump. Spectra are normalized by their average values and not corrected for reddening. Phases are in the observer frame, relative to the first LC maximum. Prominent spectral lines are indicated by vertical lines corresponding to the rest wavelengths. Vertical gray shades indicate spectral regions affected by telluric absorption. All spectroscopic data, including those presented in the subsequent figures, are available in electronic form at the CDS.
Current usage metrics show cumulative count of Article Views (full-text article views including HTML views, PDF and ePub downloads, according to the available data) and Abstracts Views on Vision4Press platform.
Data correspond to usage on the plateform after 2015. The current usage metrics is available 48-96 hours after online publication and is updated daily on week days.
Initial download of the metrics may take a while.