Open Access
Fig. 9.
Download original image
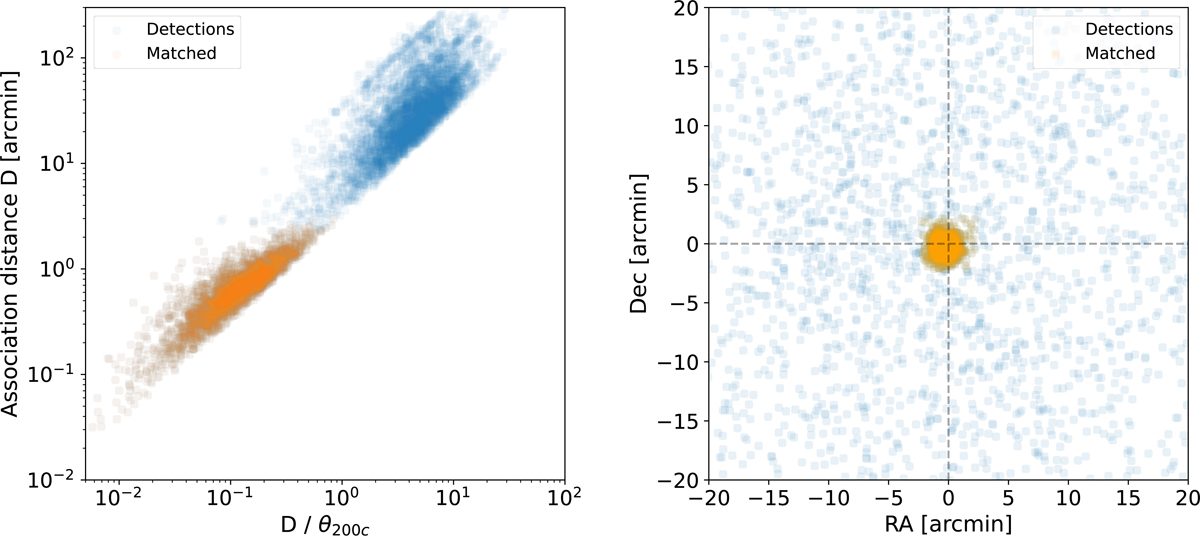
Matched detections for the W3 filter. The two panels are similar to Fig. 8. The blue dots correspond to an association between a peak detection and its closest halo. The orange dots correspond to the detections with an absolute association distance lower than the defined MMD.
Current usage metrics show cumulative count of Article Views (full-text article views including HTML views, PDF and ePub downloads, according to the available data) and Abstracts Views on Vision4Press platform.
Data correspond to usage on the plateform after 2015. The current usage metrics is available 48-96 hours after online publication and is updated daily on week days.
Initial download of the metrics may take a while.