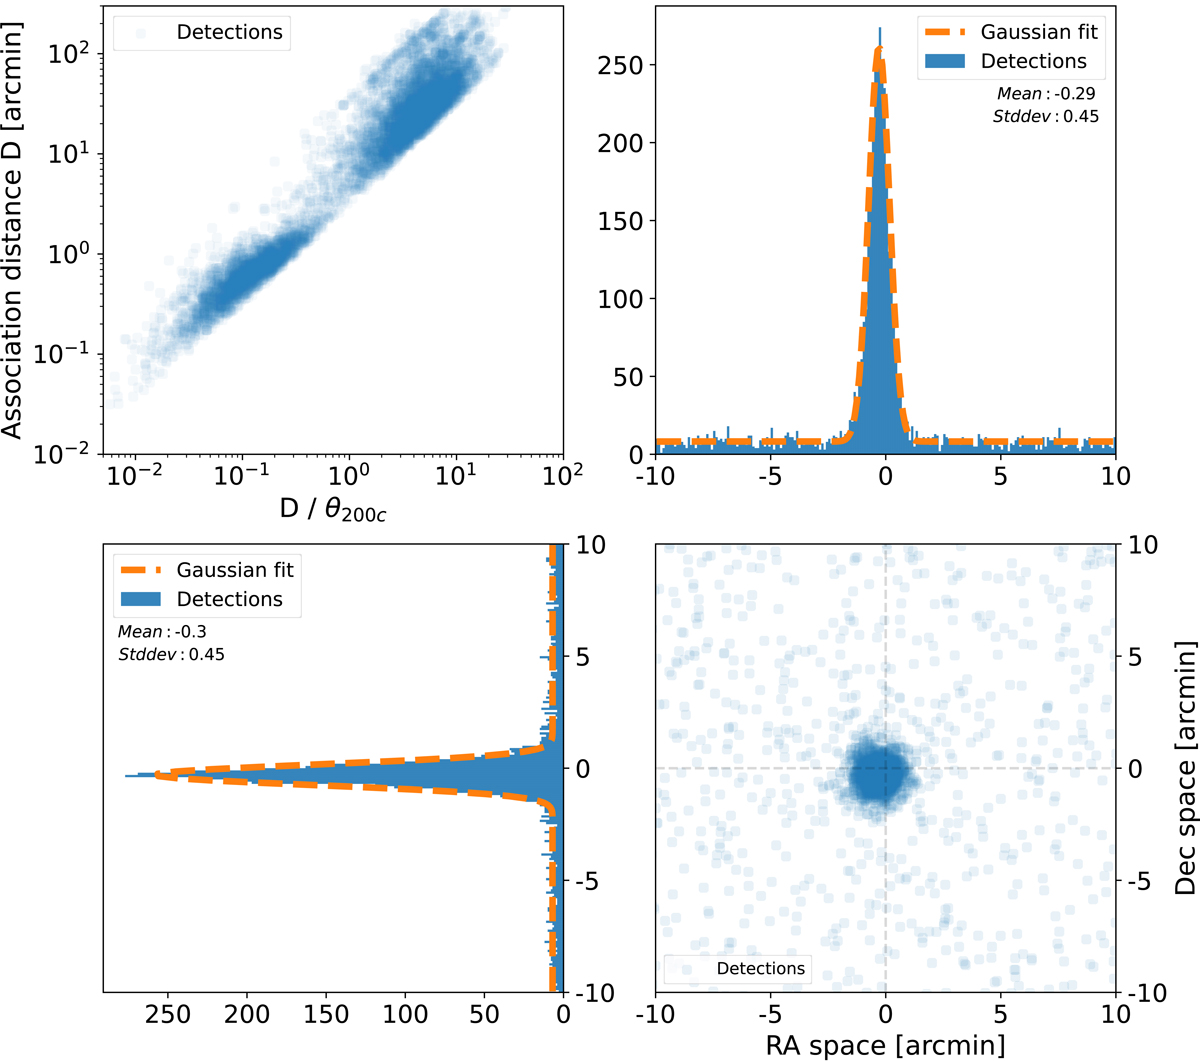
Fig. 8.
Download original image
Dispersion of the association distance (without maximum association distance) for the W3 wavelet filter, considering all 256 realisations. In all the panels, the blue dots correspond to an association between a peak detection and its closest halo. Upper left: absolute association distance, D, as a function of its normalised expression with respect to the characteristic halo radius, θ200c. Lower right: zoomed-in view of the central 20 × 20 arcmin distribution of absolute association distances expressed in RA and Dec, to highlight their dispersion. The two remaining panels show the projection of the absolute association distance distribution onto the RA and Dec axes: the projection onto the Dec axis (lower-left panel) and the projection onto the RA axis (upper-right panel). The RA and Dec axes are zoomed around the central area. On these two panels, the dashed orange line shows the result of a fit by a Gaussian function whose parameters (μ, σ) are labelled ‘Mean’ and ‘Stddev’.
Current usage metrics show cumulative count of Article Views (full-text article views including HTML views, PDF and ePub downloads, according to the available data) and Abstracts Views on Vision4Press platform.
Data correspond to usage on the plateform after 2015. The current usage metrics is available 48-96 hours after online publication and is updated daily on week days.
Initial download of the metrics may take a while.