Fig. 6.
Download original image
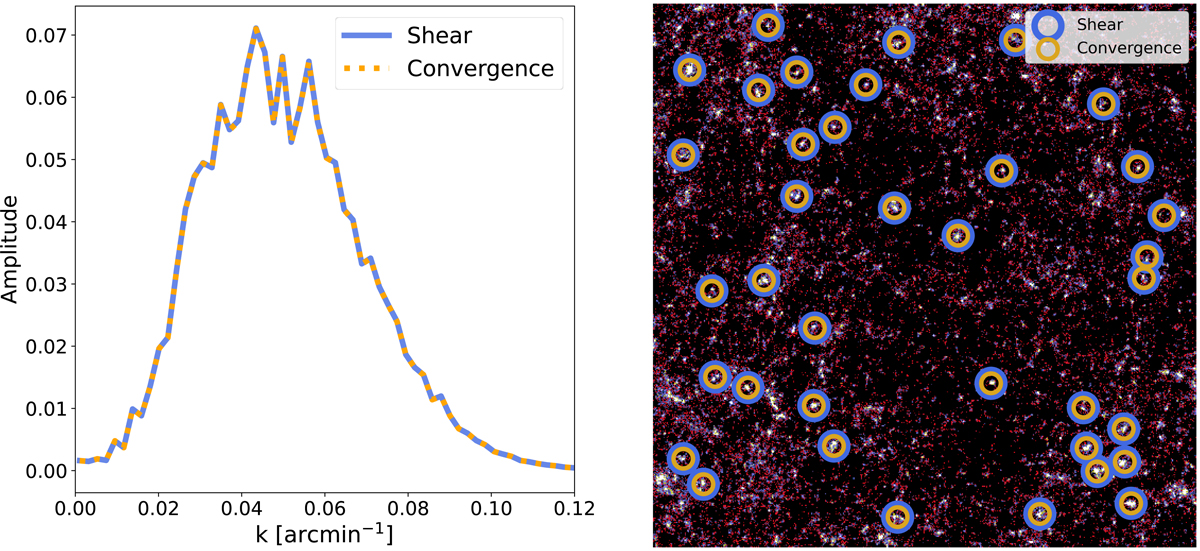
Comparison of the shear and convergence approaches. Left: power spectra of a 5° ×5° AM map with 512 × 512 pixels obtained by applying the AM J04 filter to the shear maps (blue line) and to the E-mode convergence map (orange dots) computed from the same data as in Fig. 5. The power spectra agree perfectly. Right: detections obtained on the same field when the convolution by the J04 AM filter is performed on the shear map (blue circles) and on the convergence map (golden circles). There is a one-to-one correspondence between the detections.
Current usage metrics show cumulative count of Article Views (full-text article views including HTML views, PDF and ePub downloads, according to the available data) and Abstracts Views on Vision4Press platform.
Data correspond to usage on the plateform after 2015. The current usage metrics is available 48-96 hours after online publication and is updated daily on week days.
Initial download of the metrics may take a while.