Fig. 4.
Download original image
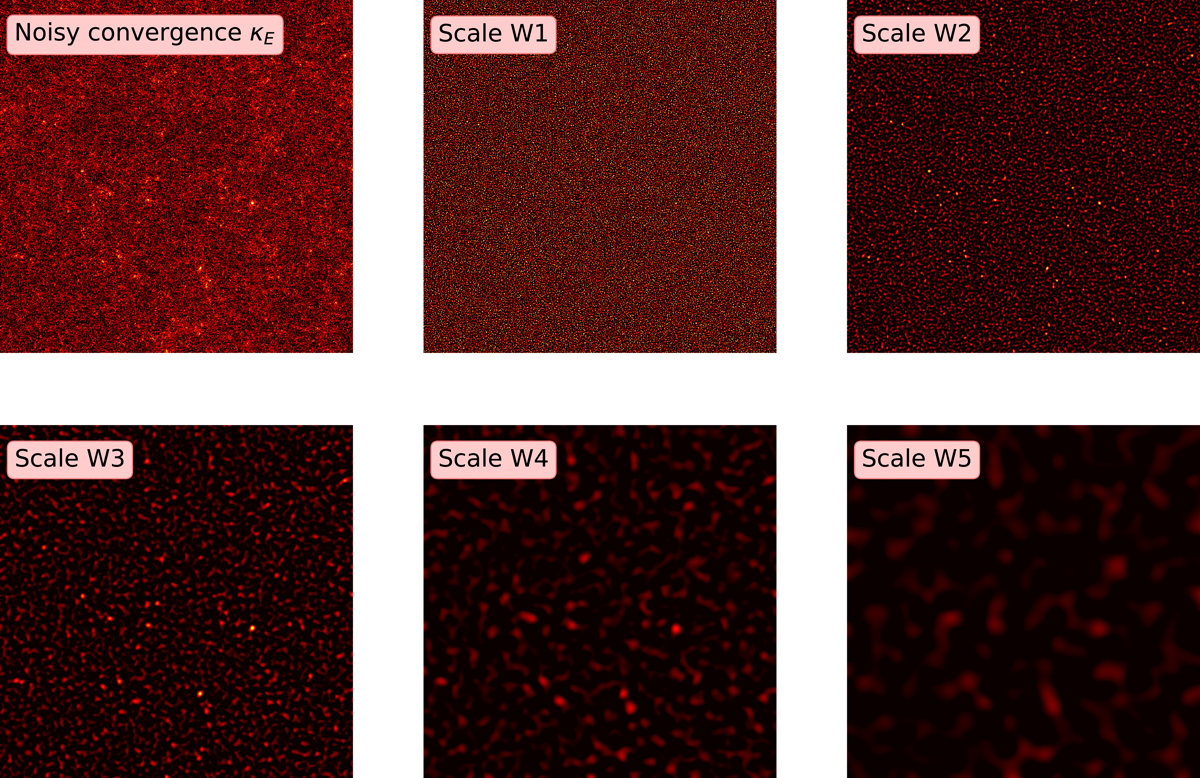
Wavelet decomposition of an E-mode convergence map (including shape noise), covering a simulated field of 5° ×5°. The upper-left panel corresponds to the E-mode convergence map to be decomposed. The other panels correspond to the wavelet maps at scale ![]() (upper-middle panel), scale
(upper-middle panel), scale ![]() (upper-right panel), scale
(upper-right panel), scale ![]() (lower-left panel), scale
(lower-left panel), scale ![]() (lower-middle panel), and scale
(lower-middle panel), and scale ![]() (lower-right panel). The wavelet maps are sensitive to structures of different apparent angular sizes. The W1 map (upper-middle panel) appears to be dominated by the shape noise. The wavelet decomposition also includes the smoothed version, which we excluded from this representation.
(lower-right panel). The wavelet maps are sensitive to structures of different apparent angular sizes. The W1 map (upper-middle panel) appears to be dominated by the shape noise. The wavelet decomposition also includes the smoothed version, which we excluded from this representation.
Current usage metrics show cumulative count of Article Views (full-text article views including HTML views, PDF and ePub downloads, according to the available data) and Abstracts Views on Vision4Press platform.
Data correspond to usage on the plateform after 2015. The current usage metrics is available 48-96 hours after online publication and is updated daily on week days.
Initial download of the metrics may take a while.