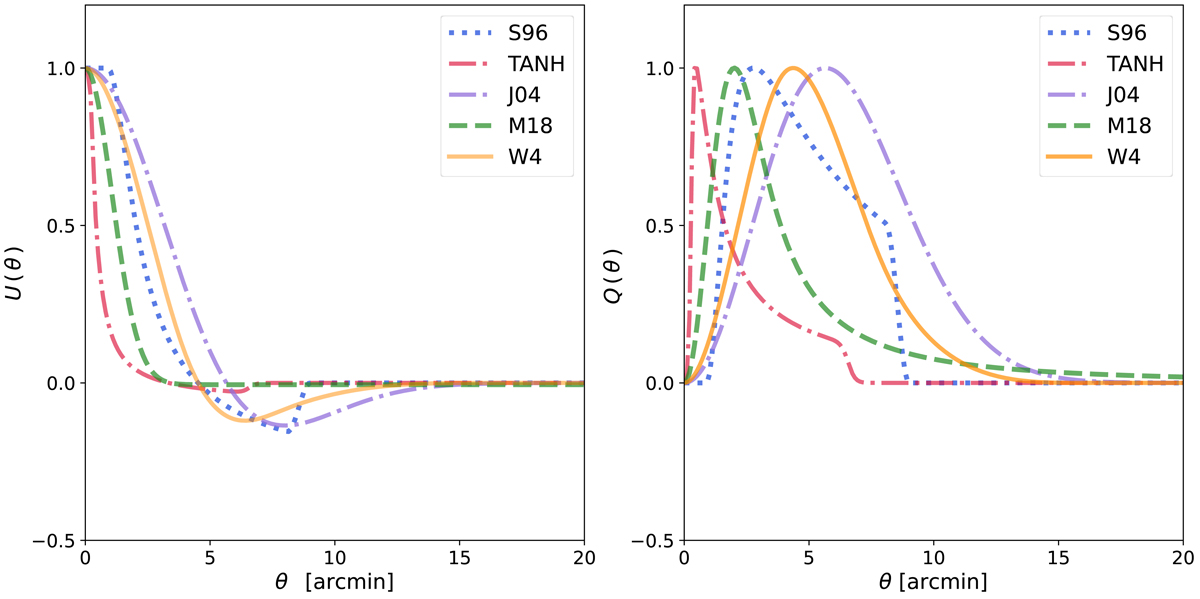
Fig. 2.
Download original image
Comparison of different filter functions, U (left) and Q (right), for AM map reconstruction. The figure shows in blue (dotted lines) the AM filter functions defined by Schneider (1996, S96) with R = 9′; in red (dash-dotted lines) the AM filter functions defined in Schirmer (2004, TANH) with R = 7′; in purple (dash-dotted lines) the AM filter functions defined in Jarvis et al. (2004, J04) with σ = 4′; and in green (dashed lines) the AM filter functions defined by Miyazaki et al. (2018, M18). The filter UM18 is also a compensated filter thanks to the U0 term, but due to the high truncation radius we used, this is not distinctly visible. Finally, the AM filter functions corresponding to the wavelet filter functions at scale i = 4 are displayed in orange (solid lines). All the filters are normalised to have a maximum amplitude of 1.
Current usage metrics show cumulative count of Article Views (full-text article views including HTML views, PDF and ePub downloads, according to the available data) and Abstracts Views on Vision4Press platform.
Data correspond to usage on the plateform after 2015. The current usage metrics is available 48-96 hours after online publication and is updated daily on week days.
Initial download of the metrics may take a while.