Open Access
Fig. A.1.
Download original image
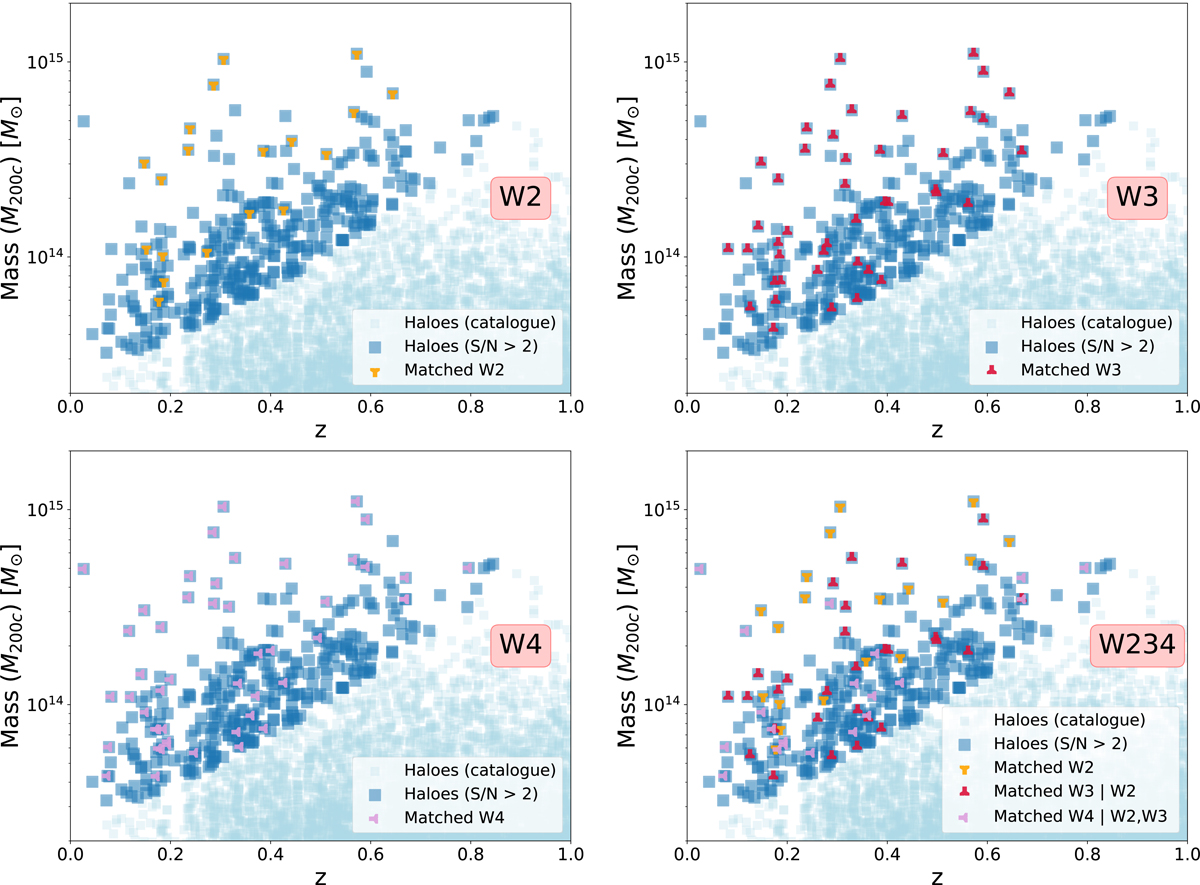
Distribution of the matched clusters in the z-M plane for one 5° ×5° patch, obtained using the W2 wavelet filter (upper-left panel), W3 wavelet filter (upper-right panel), W4 wavelet filter (lower-left panel), and the multi-scale approach (lower-right panel).
Current usage metrics show cumulative count of Article Views (full-text article views including HTML views, PDF and ePub downloads, according to the available data) and Abstracts Views on Vision4Press platform.
Data correspond to usage on the plateform after 2015. The current usage metrics is available 48-96 hours after online publication and is updated daily on week days.
Initial download of the metrics may take a while.