Fig. 13
Download original image
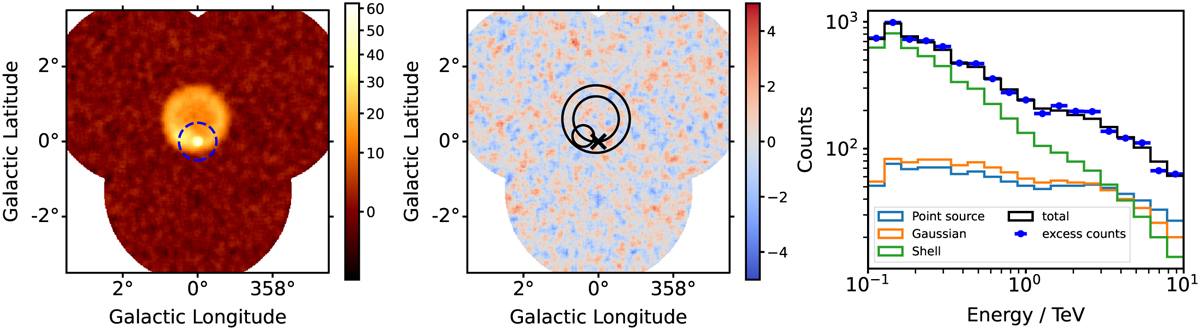
Example of a 3D analysis for simulated sources with point-like, Gaussian and shell-like morphologies. The simulation uses “prod5” IRFs from CTA (Cherenkov Telescope Array Observatory & Cherenkov Telescope Array Consortium 2021). The left image shows a significance map (using the Cash statistics) where the three simulated sources can be seen. The middle figure shows another significance map, but this time after subtracting the best-fit model for each of the sources, which are displayed in black. The right figure shows the contribution of each source model to the circular region of radius 0.5° drawn in the left image, together with the excess counts inside that region.
Current usage metrics show cumulative count of Article Views (full-text article views including HTML views, PDF and ePub downloads, according to the available data) and Abstracts Views on Vision4Press platform.
Data correspond to usage on the plateform after 2015. The current usage metrics is available 48-96 hours after online publication and is updated daily on week days.
Initial download of the metrics may take a while.