Fig. A.1.
Download original image
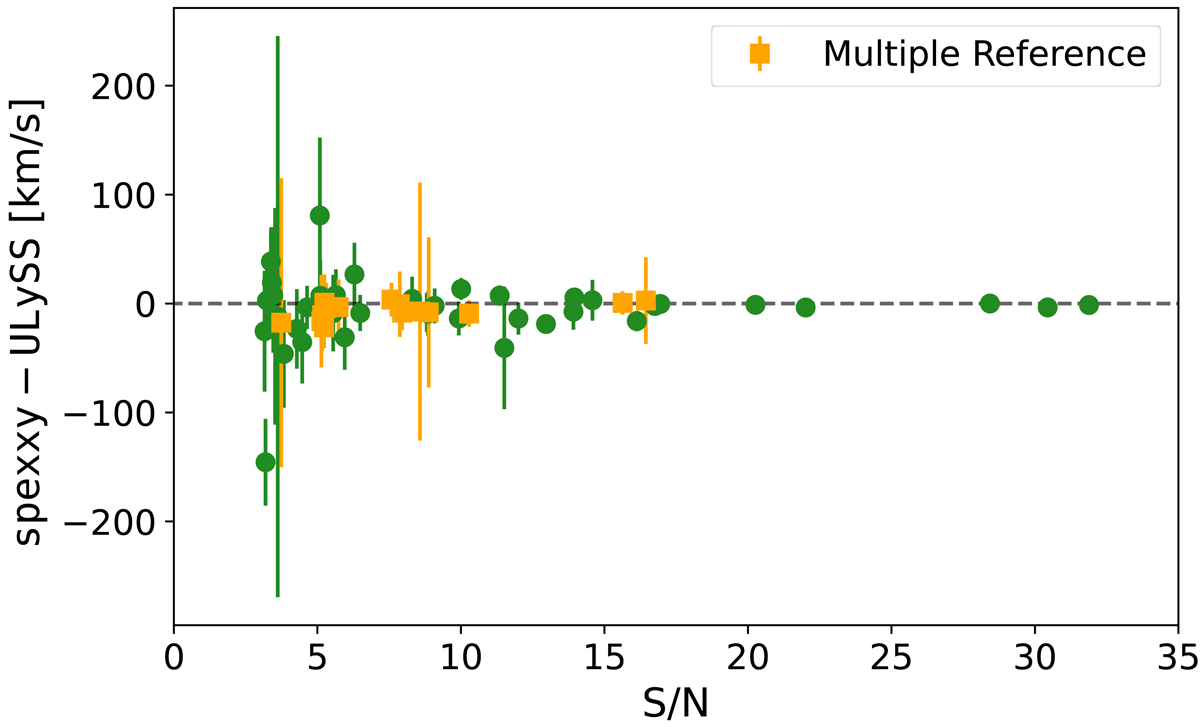
Difference between spexxy and ULySS velocity measurements as a function of S/N. The displayed error was determined by summing the respective measurement uncertainties in quadrature. The stars for which the ULySS best-fit run used multiple reference spectra are displayed as orange squares. A horizontal dashed line at zero is also shown.
Current usage metrics show cumulative count of Article Views (full-text article views including HTML views, PDF and ePub downloads, according to the available data) and Abstracts Views on Vision4Press platform.
Data correspond to usage on the plateform after 2015. The current usage metrics is available 48-96 hours after online publication and is updated daily on week days.
Initial download of the metrics may take a while.