Open Access
Fig. 11.
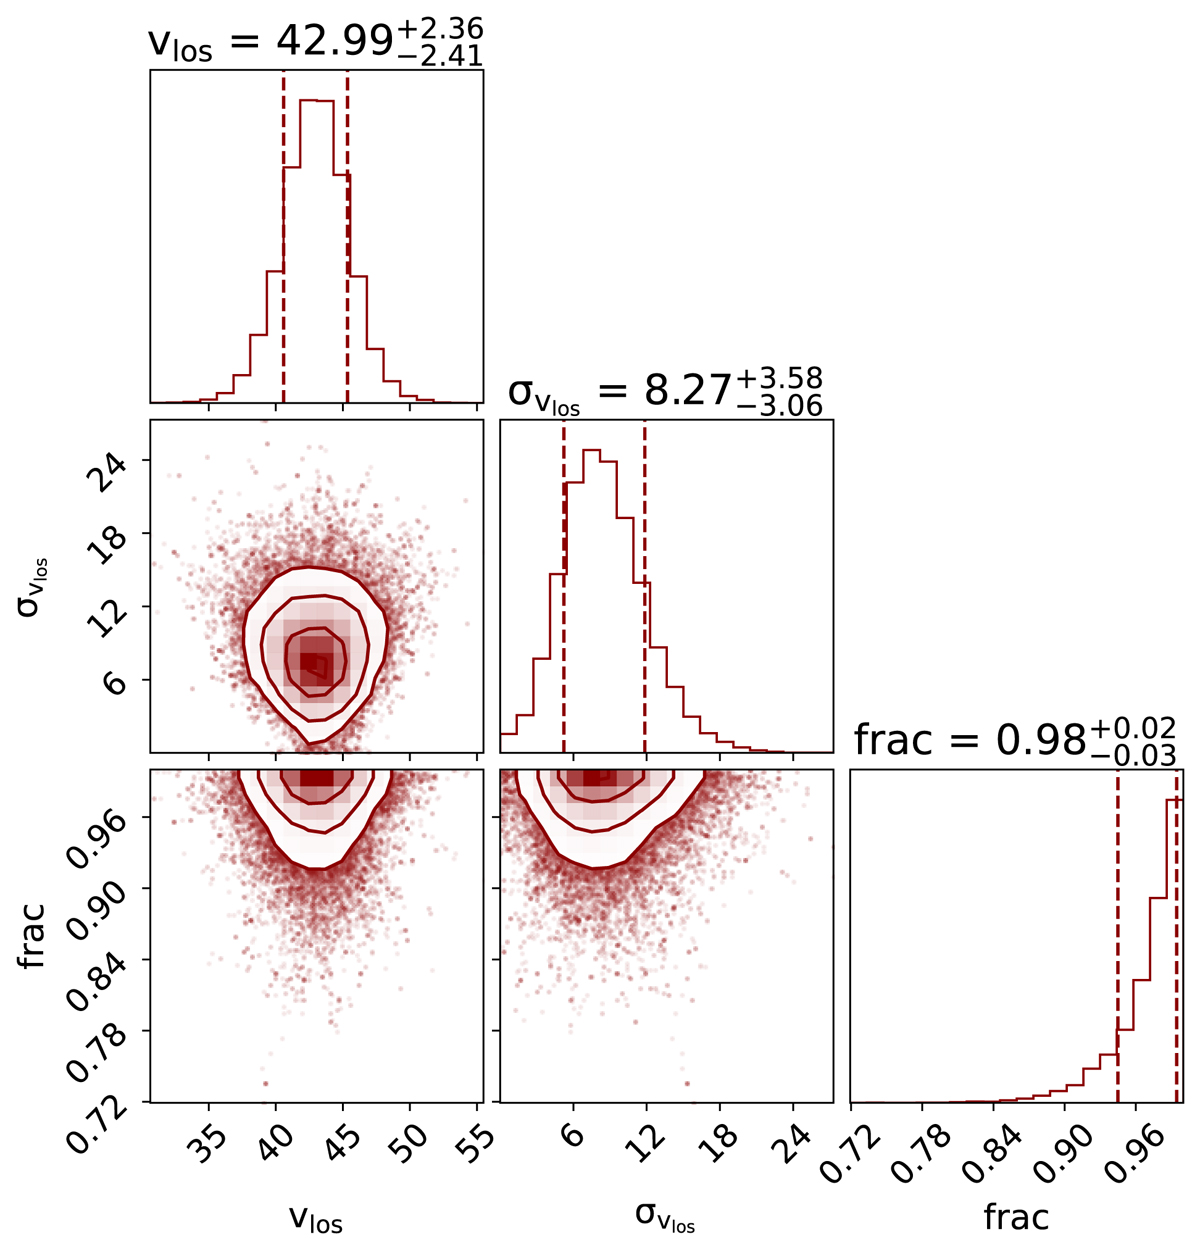
Download original image
Corner plot for the MCMC velocity fit using the sample of 38 stars with ages of ≥1 Gyr within the MUSE FoV. We show the mean value vlos, dispersion σv, and fraction of stars consistent with the model.
Current usage metrics show cumulative count of Article Views (full-text article views including HTML views, PDF and ePub downloads, according to the available data) and Abstracts Views on Vision4Press platform.
Data correspond to usage on the plateform after 2015. The current usage metrics is available 48-96 hours after online publication and is updated daily on week days.
Initial download of the metrics may take a while.