Fig. 9
Download original image
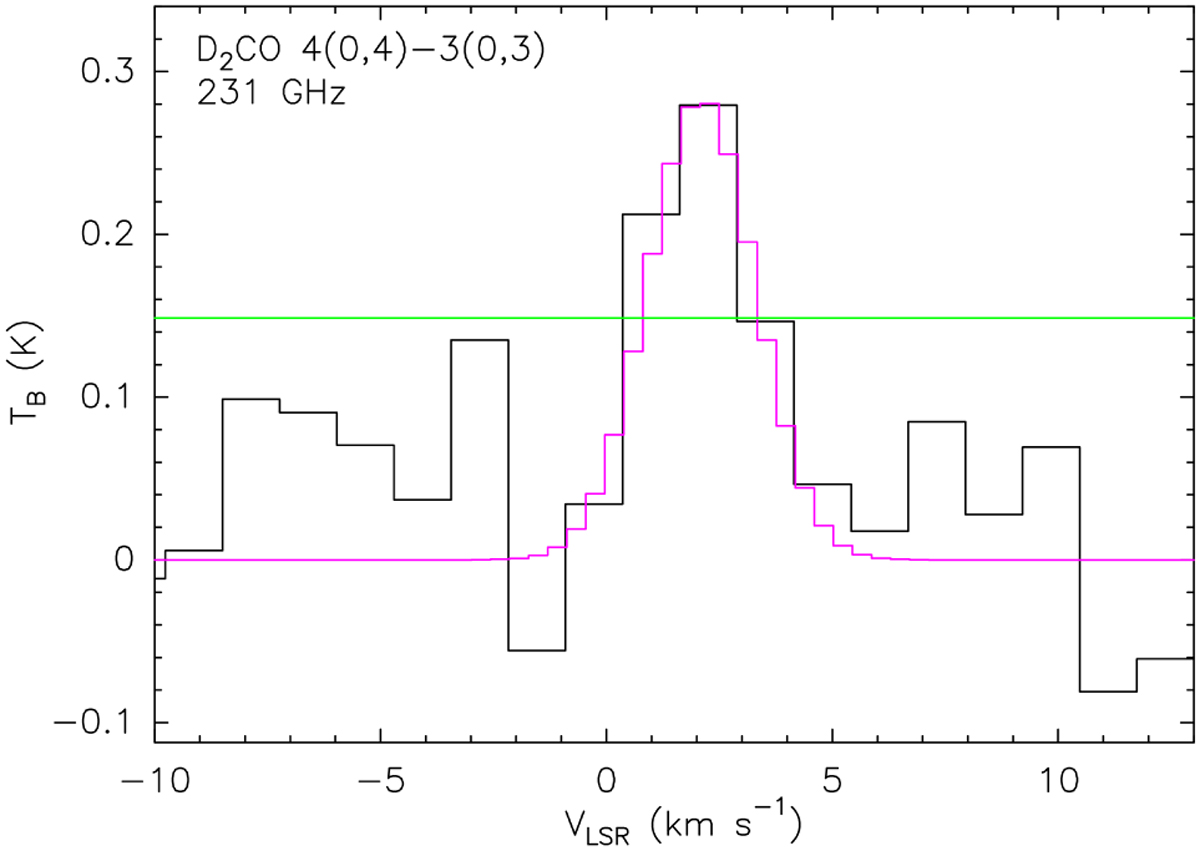
D2CO 4(0,4)−3(0,3) spectrum (black) with a velocity resolution of 0.16 km s−1 extracted from the 4σ contour shown in Fig. 4 and smoothed three times with the Hanning algorithm overlaid with best fit (pink) obtained using single-component Gaussian fitting with FWHM, VLSR and Tex constrained using values obtained from fitting the HDCO transitions. The analysis was run twice, assuming upper limit values for the size of the emitting region of 0.3″ (covering source B emission) and 1.0″ (covering source A emission); the figure shown represents the latter. The rms level (0.15 K) is shown in green.
Current usage metrics show cumulative count of Article Views (full-text article views including HTML views, PDF and ePub downloads, according to the available data) and Abstracts Views on Vision4Press platform.
Data correspond to usage on the plateform after 2015. The current usage metrics is available 48-96 hours after online publication and is updated daily on week days.
Initial download of the metrics may take a while.