Fig. 8
Download original image
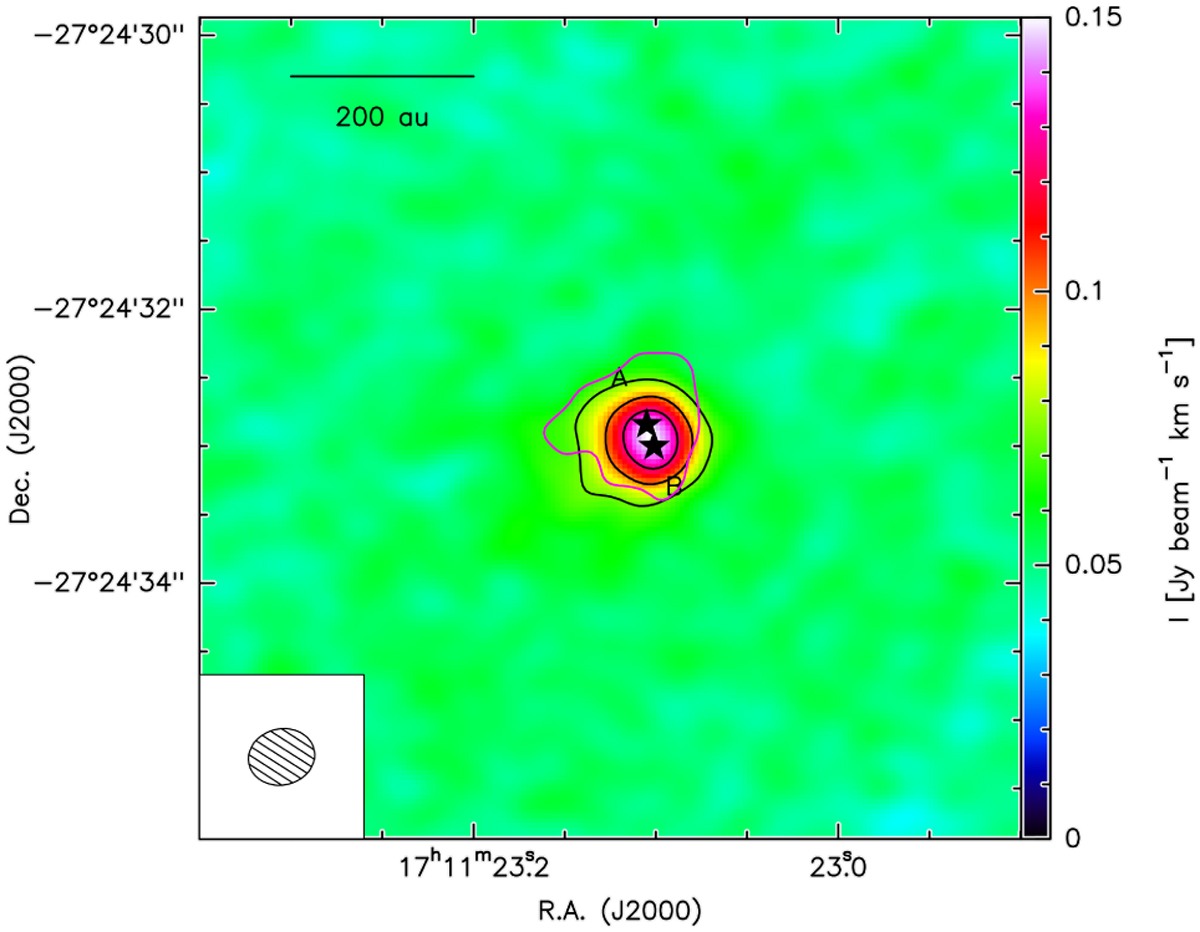
Moment 0 map of HDCO 4(1,4)−3(1,3) integrated between -5 and 8 km s−1. This velocity range was chosen to include the two unblended HDCO emission components shown in Fig. 6. Contours start at 4σ and end at 16σ in 4σ increments (σ = 8.5 mJy beam−1 km s−1). The pink contour illustrates the area within which the spectrum in Fig. 6 was extracted, defined as the 4σ contour shown in Fig. 4. The locations of protostars A and B are shown by the black stars. The ALMA synthesised beam is shown in the lower left corner.
Current usage metrics show cumulative count of Article Views (full-text article views including HTML views, PDF and ePub downloads, according to the available data) and Abstracts Views on Vision4Press platform.
Data correspond to usage on the plateform after 2015. The current usage metrics is available 48-96 hours after online publication and is updated daily on week days.
Initial download of the metrics may take a while.