Fig. 5
Download original image
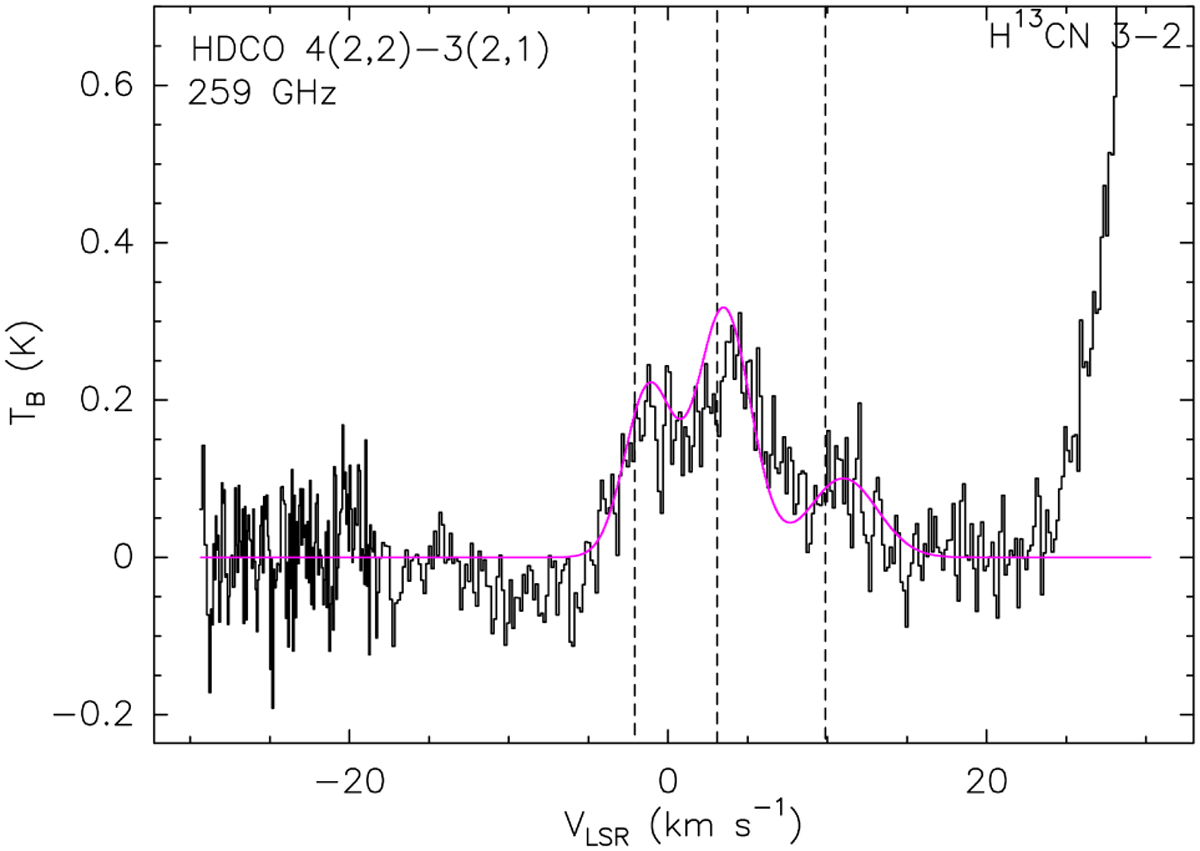
HDCO spectrum (black) with a velocity resolution of 0.14 km s−1 for the 4(2,2)−3(2,1) transition overlaid with the best fit (pink) from our simultaneous radiative transfer analysis, extracted within the 4σ contour shown in Fig. 4. The analysis was run twice, assuming upper limits for the size of the emitting region of 1.0″ and 0.3″ for Sources A and B, respectively and lower limits of 0.5″ and 0.15″ for Sources A and B, respectively; the figure shown represents the latter. Dashed lines denote the previously identified velocity components at −2, 2.8 and 9.9 km s−1.
Current usage metrics show cumulative count of Article Views (full-text article views including HTML views, PDF and ePub downloads, according to the available data) and Abstracts Views on Vision4Press platform.
Data correspond to usage on the plateform after 2015. The current usage metrics is available 48-96 hours after online publication and is updated daily on week days.
Initial download of the metrics may take a while.