Fig. 4
Download original image
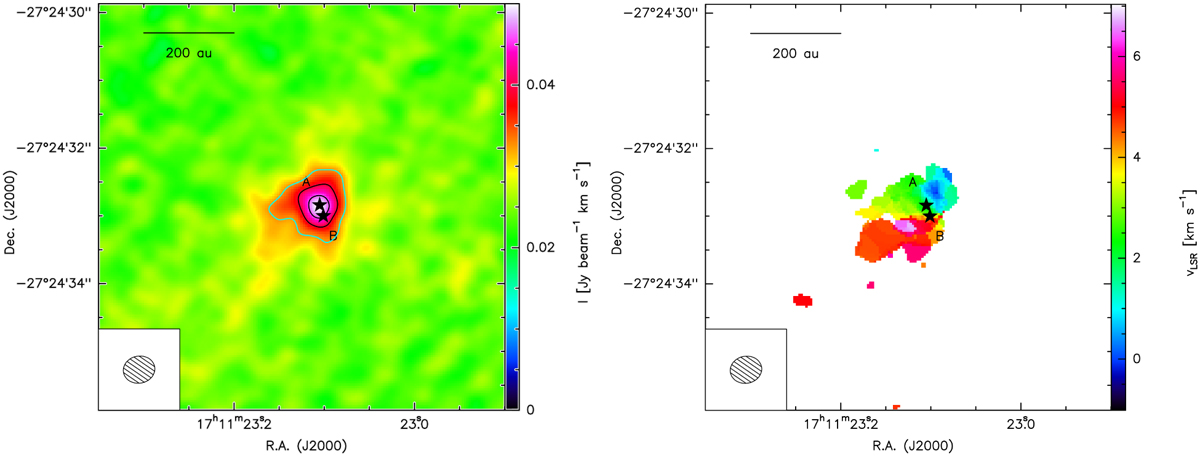
Emission maps for HDCO 4(2,2)−3(2,1). Left panel: HDCO 4(2,2)−3(2,1) moment 0 map integrated between −1 and 7 km s−1 that peaks at the position of the dust emission. Observations performed using both 12 m and 7 m ALMA configurations are combined in this map in order to investigate both large- and small-scale structure. Contours start at 4σ and end at 10σ in 3σ increments (σ = 4.1 mJy beam−1 km s−1). The 4σ contour is highlighted in cyan as this is the contour that served as the extraction polygon for all spectra shown in this work. Right panel: Moment 1 map of HDCO 4(2,2)−3(2,1) integrated between −1 and 7 km s−1, in order to directly compare with the moment 0 map and to show the velocity structure of the disk. In both maps, the locations of the protostars A and B are shown by black stars. The ALMA synthesised beam is in the lower left corner.
Current usage metrics show cumulative count of Article Views (full-text article views including HTML views, PDF and ePub downloads, according to the available data) and Abstracts Views on Vision4Press platform.
Data correspond to usage on the plateform after 2015. The current usage metrics is available 48-96 hours after online publication and is updated daily on week days.
Initial download of the metrics may take a while.