Fig. 3
Download original image
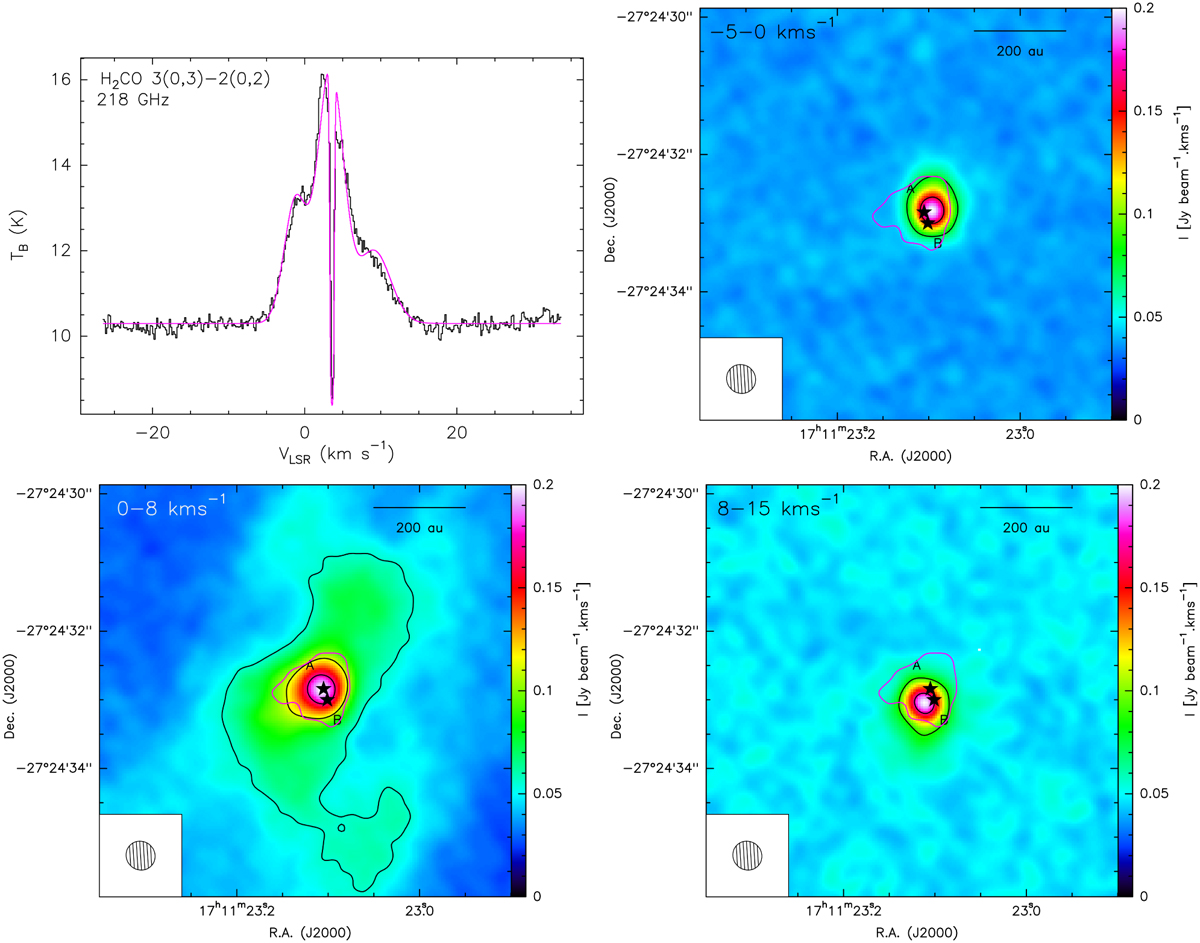
Comparing the multiple velocity components of the H2CO 3(0,3)−2(0,2) emission. Upper left: H2CO 3(0,3)−2(0,2) spectrum (black) with velocity resolution 0.17 km s−1 covering the full velocity range of −5 to 15 km s−1, extracted from the region where HDCO 4(2,2)−3(2,1) emission is above 4σ, overlaid with the best fit (pink) obtained using four Gaussian fits with FWHM, υLSR and Tex constrained using values obtained from fitting the HDCO transitions. A continuum value of 10.3 K has been added to this spectrum in order to model the absorption feature located at the systemic velocity of 3.6 km s−1. Upper right, lower left, lower right: H2CO 3(0,3)−2(0,2) moment 0 map integrated between −5 and 0 km s−1, between 0 and 8 km s−1 and between 8 and 15 km s−1, respectively, in order to individually show the velocity components of emission shown in the upper left panel. Contours begin at 4σ and are in increments of 8σ (σ = 17.6 mJy beam−1 km s−1). The pink contour illustrates the area within which the spectrum in the upper left panel was extracted, defined as the 4σ contour of the HDCO 4(2,2)−3(2,1) moment 0 map (see Fig. 4). The ALMA synthesised beam is in the lower left corner of all three maps.
Current usage metrics show cumulative count of Article Views (full-text article views including HTML views, PDF and ePub downloads, according to the available data) and Abstracts Views on Vision4Press platform.
Data correspond to usage on the plateform after 2015. The current usage metrics is available 48-96 hours after online publication and is updated daily on week days.
Initial download of the metrics may take a while.