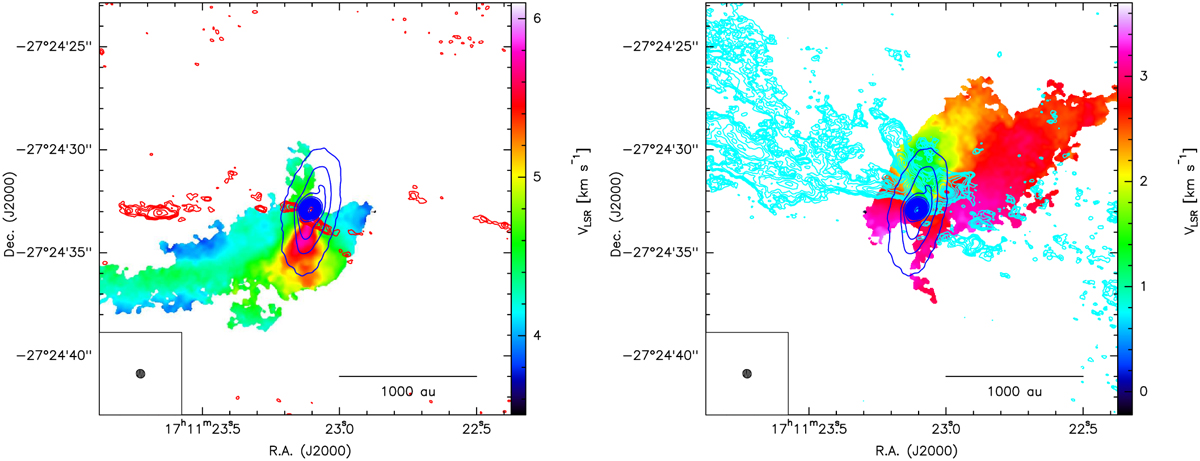
Fig. 2
Download original image
Colour scale: H2CO 3(0,3)−2(0,2) centroid velocity map from pixel-by-pixel Gaussian analysis showing pixels with intensity above 5σ in the redshifted (left panel; integrated between 3.5 and 6 km s−1) and blueshifted (right panel; integrated between 0 and 3.5 km s−1) regimes; the systemic velocity is ~3.6 km s−1. Blue contours: 1.3 mm continuum contours starting at 4σ and ending at 300σ in intervals of 15σ (σ = 0.19 mJy beam−1) indicating disk emission. Red (left panel) and cyan (right panel) contours: Redshifted and blueshifted (respectively) CO 2−1 emission from Alves et al. (2017) detailing outflow emission seen at 8.67 km s−1 and −0.78 km s−1, respectively, representing the channels with the most extended outflow CO 2−1 emission. Contours are at 4, 6, 8, 10, 15, 20, 30, 40, 50, 60, 70, 80 and 90 times σ – which is 2.8 mJy beam−1 – in order to match the CO 2−1 observations, which have a beamsize of 0.2″ × 0.25″. The ALMA synthesised beam for the H2CO observations, with a beamsize of 0.43″ × 0.41″ is shown in the lower left corner.
Current usage metrics show cumulative count of Article Views (full-text article views including HTML views, PDF and ePub downloads, according to the available data) and Abstracts Views on Vision4Press platform.
Data correspond to usage on the plateform after 2015. The current usage metrics is available 48-96 hours after online publication and is updated daily on week days.
Initial download of the metrics may take a while.