Fig. A.2
Download original image
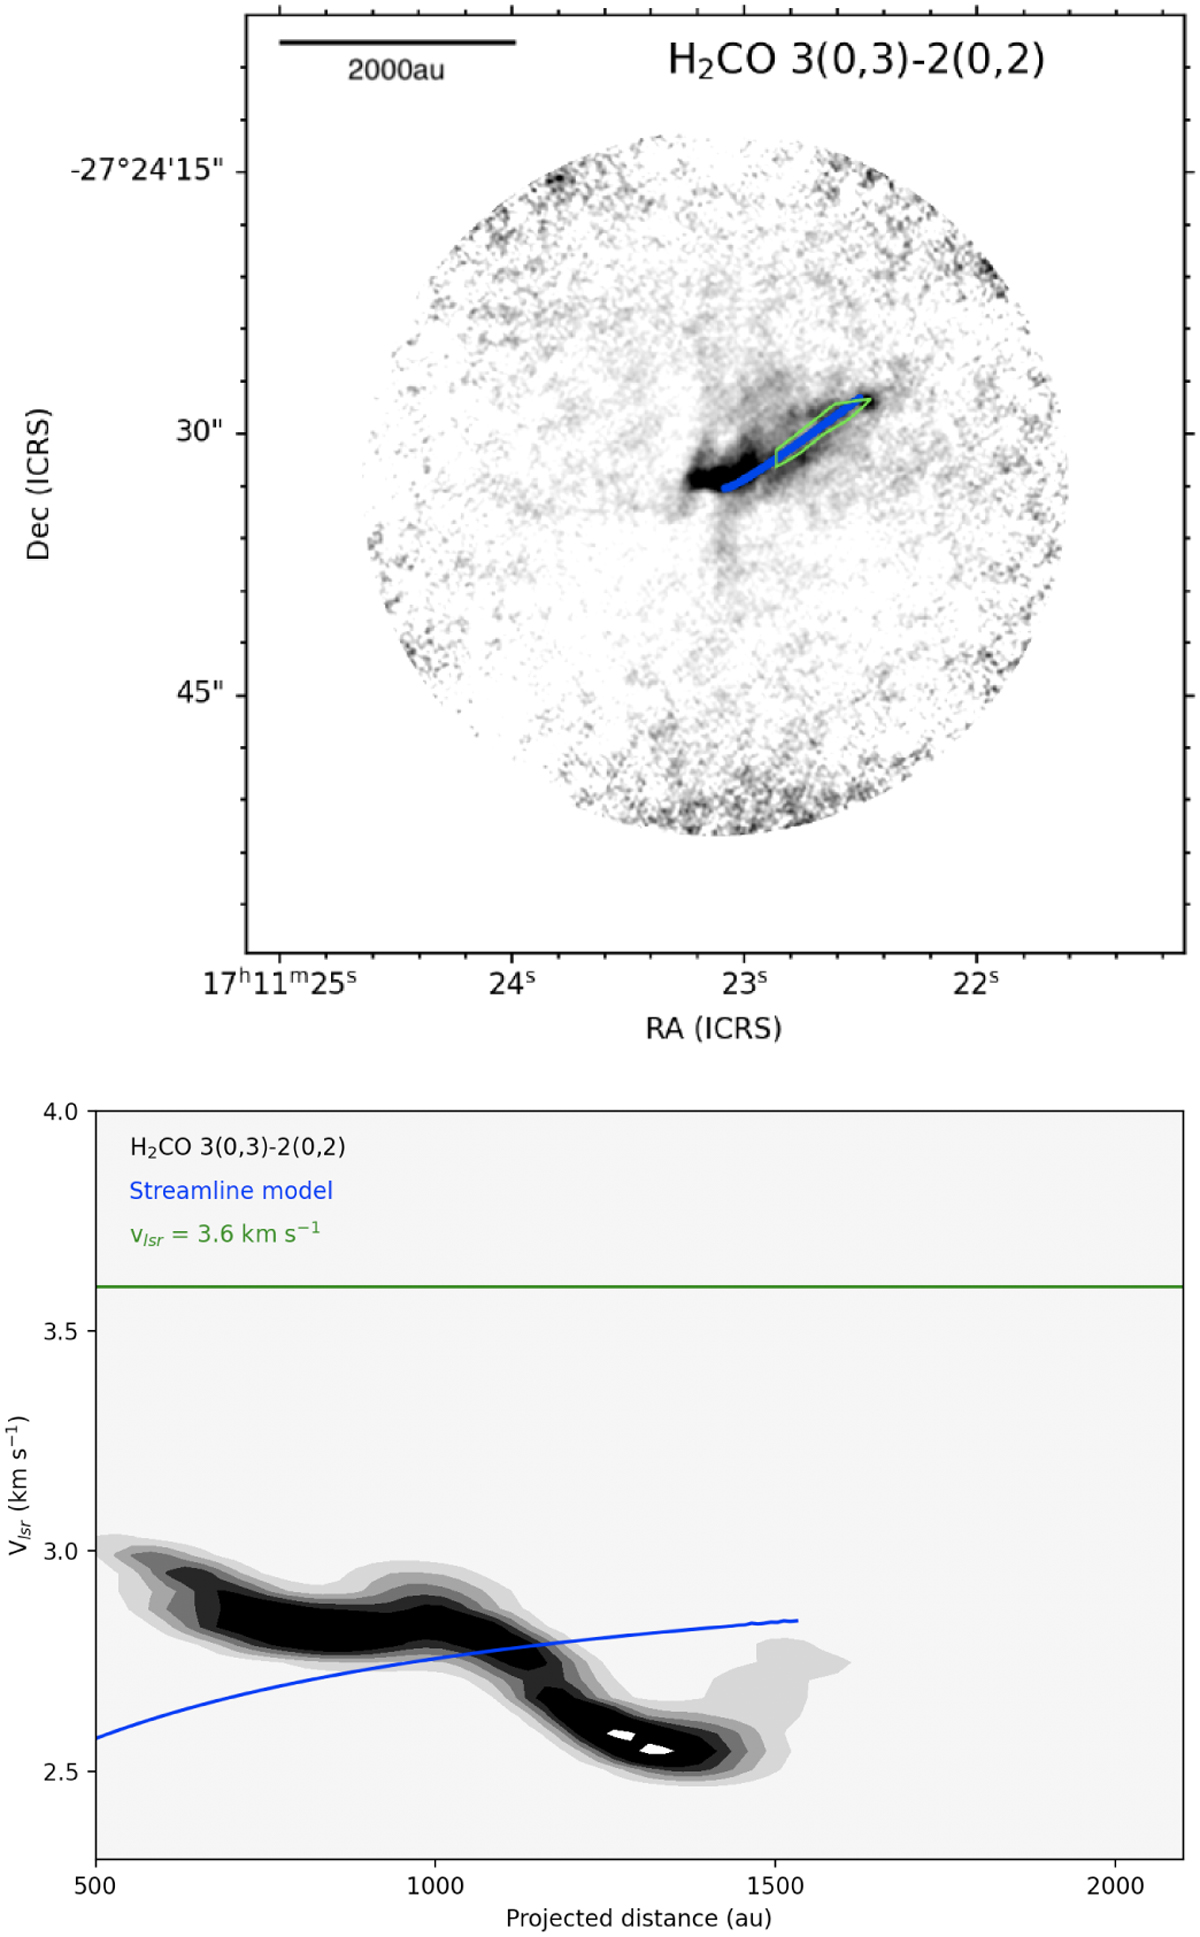
Streamer modelling results for a blueshifted streamer. Upper panel: Streamline (blue) generated using best-fit initial parameters superimposed onto the H2CO 3(0,3)-2(0,2) moment 0 map first presented in the left panel of Fig. 1. Lower panel: Velocity of the streamer as a function of the distance from the source centre for raw data (black) and the model (blue), with the VLSR value shown in green.
Current usage metrics show cumulative count of Article Views (full-text article views including HTML views, PDF and ePub downloads, according to the available data) and Abstracts Views on Vision4Press platform.
Data correspond to usage on the plateform after 2015. The current usage metrics is available 48-96 hours after online publication and is updated daily on week days.
Initial download of the metrics may take a while.