Fig. A.1
Download original image
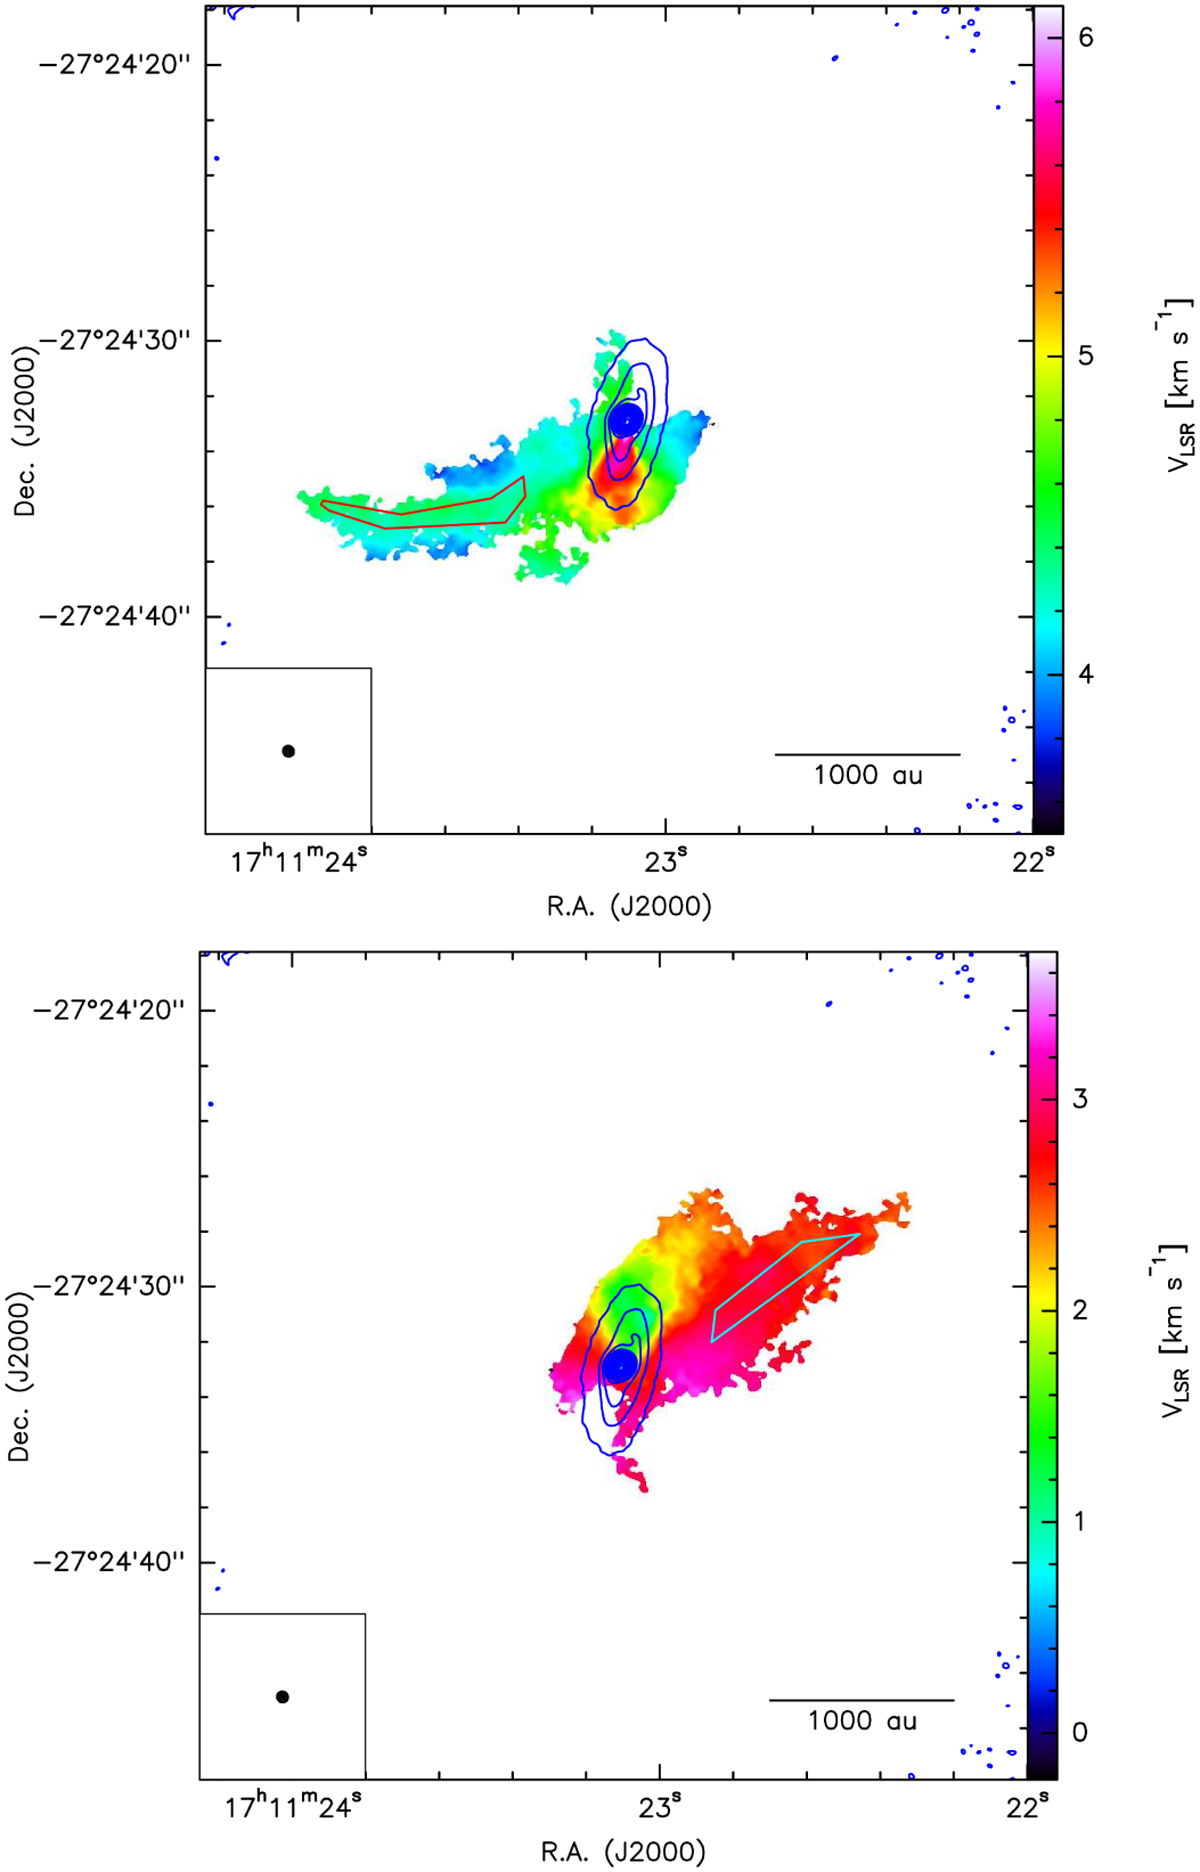
Centroid velocity maps from pixel-by-pixel Gaussian analysis showing pixels with intensity above 5σ for the redshifted (upper panel; integrated between 3.5 and 6 km s−1) and blueshifted (lower panel; integrated between 0 and 3.5 km s−1) features overlaid with continuum emission (blue contours) between 4σ and 300σ in 50σ intervals (σ=0.19 mJy beam−1). Polygons representing the pixels included in the kinematic model of the streamers are shown in red (upper panel) and cyan (lower panel). The ALMA synthesised beam is shown in the lower left corner.
Current usage metrics show cumulative count of Article Views (full-text article views including HTML views, PDF and ePub downloads, according to the available data) and Abstracts Views on Vision4Press platform.
Data correspond to usage on the plateform after 2015. The current usage metrics is available 48-96 hours after online publication and is updated daily on week days.
Initial download of the metrics may take a while.