Fig. 11
Download original image
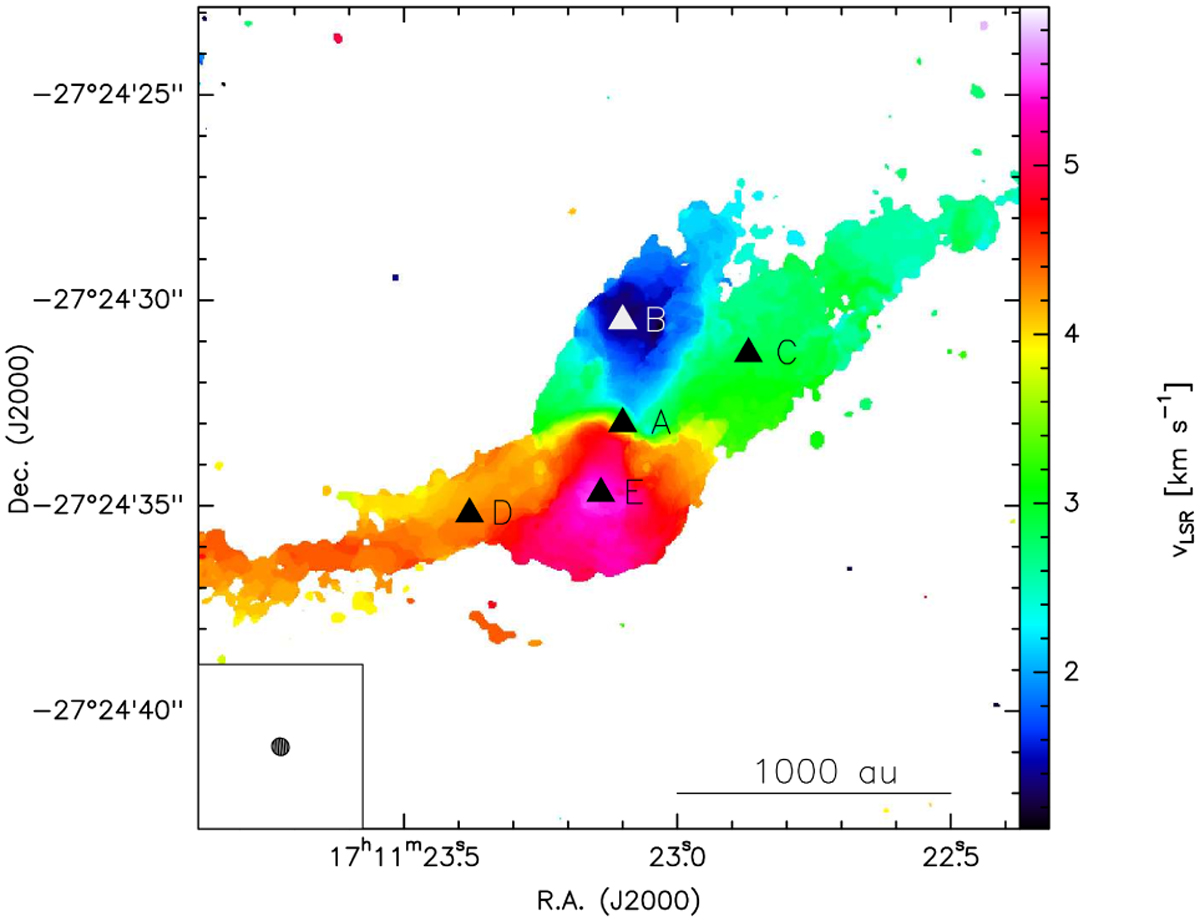
H2CO moment 1 map in colour scale with five pixels overlaid in black and white (for clarity in this case) triangles, chosen as the pixel at the location of the dust peak (A), along with the most intense pixels for each velocity range (B: 0−2 km s−1, C: 2.5−3.5 km s−1, D: 3.5−4 km s−1 and E: 5−6 km s−1). The ellipse in the bottom-left corner represents the ALMA synthesised beam.
Current usage metrics show cumulative count of Article Views (full-text article views including HTML views, PDF and ePub downloads, according to the available data) and Abstracts Views on Vision4Press platform.
Data correspond to usage on the plateform after 2015. The current usage metrics is available 48-96 hours after online publication and is updated daily on week days.
Initial download of the metrics may take a while.