Fig. 10
Download original image
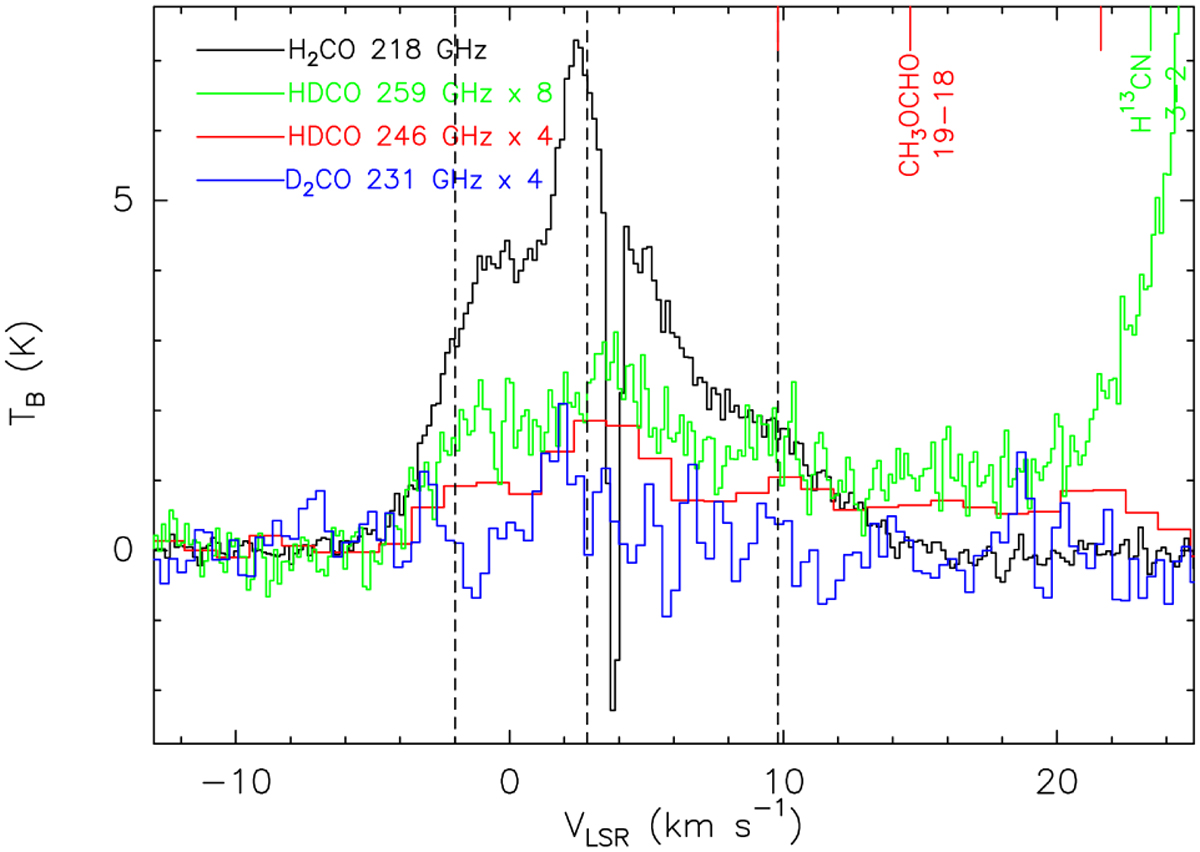
Comparison of H2CO 3(0,3)–2(0,2), D2CO 4(0,4)–3(0,3), HDCO 4(1,4)–3(1,3) and HDCO 4(2,2)–3(2,1) lines with the baselines subtracted. The dashed lines represent velocities of –2, 2.8 and 9.9 km s−1. The CH3OCHO 19(4,15)–18(4,14) A transition (246.9147 GHz) that is near HDCO 4(1,4)–3(1,3) is shown in red, while the H13CN (3−2) transition (259.0118 GHz) in the same spw as HDCO 4(2,2)–3(2,1) is denoted in green.
Current usage metrics show cumulative count of Article Views (full-text article views including HTML views, PDF and ePub downloads, according to the available data) and Abstracts Views on Vision4Press platform.
Data correspond to usage on the plateform after 2015. The current usage metrics is available 48-96 hours after online publication and is updated daily on week days.
Initial download of the metrics may take a while.