Fig. 1
Download original image
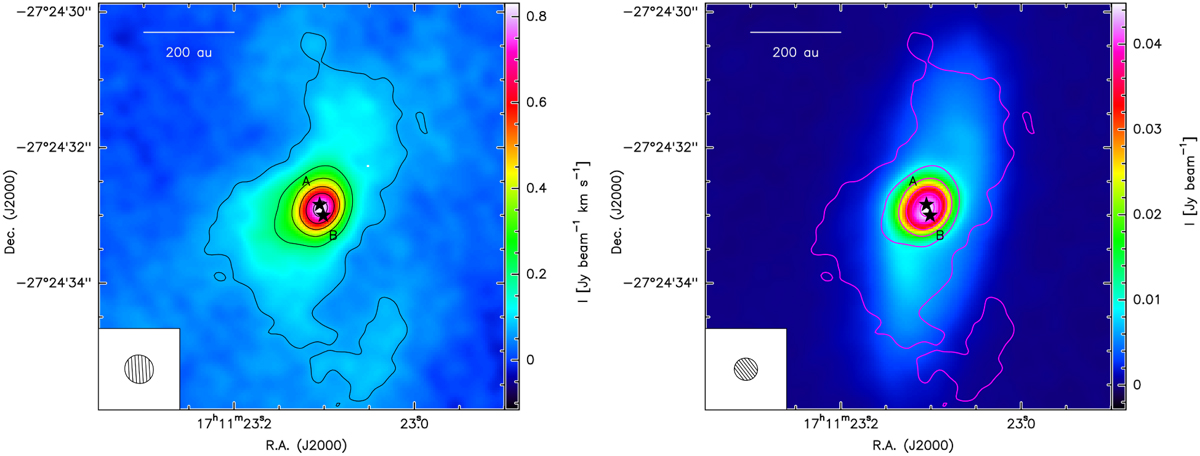
Comparing continuum and line emission. Left panel: H2CO 3(0,3)−2(0,2) moment 0 map integrated between −5 and 15 km s−1. This velocity range was chosen as this represents the full range of emission detected at or above 4σ. Right panel: 216 GHz continuum emission (colour scale) taken from the FAUST dataset with H2CO 3(0,3)−2(0,2) overlaid in pink contours. In both images, contours start at 4σ and end at 44σ in 8σ increments (σ = 17.6 mJy beam−1 km s−1), the positions of protostars A and B are represented by the black stars and the ALMA synthesised beam is shown in the lower left corner.
Current usage metrics show cumulative count of Article Views (full-text article views including HTML views, PDF and ePub downloads, according to the available data) and Abstracts Views on Vision4Press platform.
Data correspond to usage on the plateform after 2015. The current usage metrics is available 48-96 hours after online publication and is updated daily on week days.
Initial download of the metrics may take a while.