Fig. 7.
Download original image
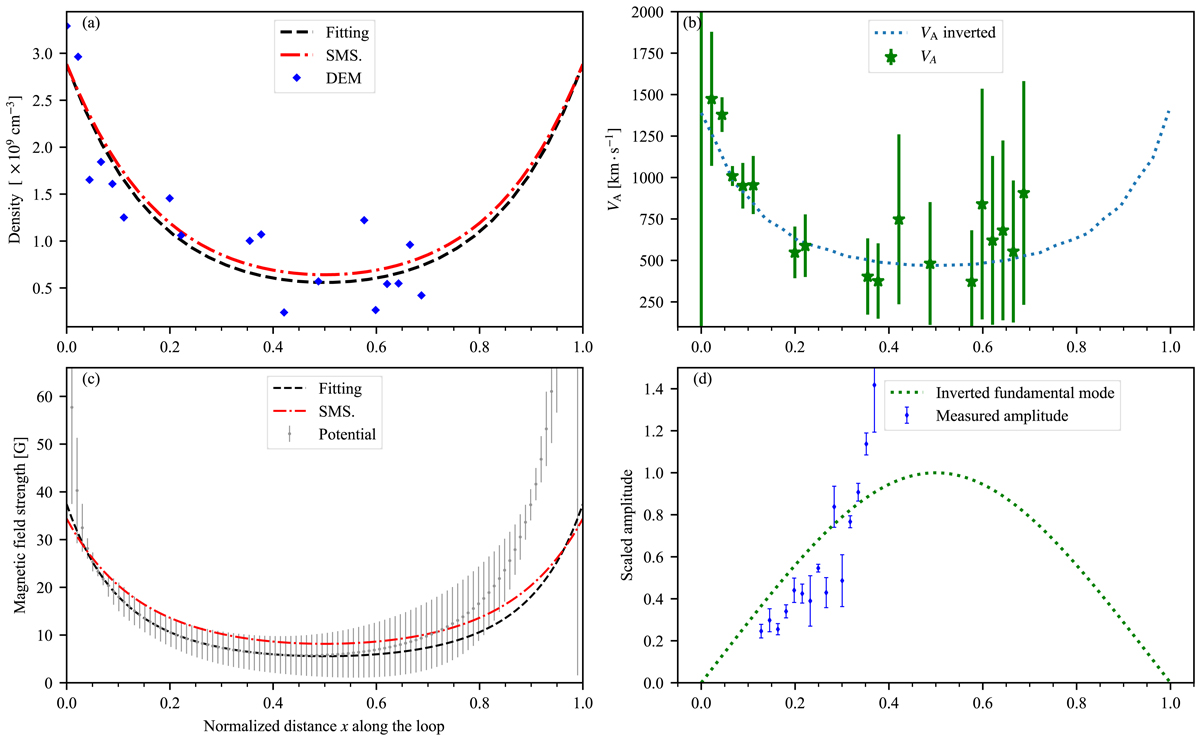
Inversion results of spatial seismology. Panel a: density distribution computed by DEM diagnostics (the blue diamonds), the inversion result of spatial seismology (the red dashed line), and the fitting result to the observed data using an exponentially damping profile (the black dashed line). Panel b: distribution of the measured Alfvén speed (the green star point) and the fitted Alfvén speed (the blue dotted line). Panel c: distribution of the magnetic field strength extrapolated from the potential field model (the gray points with error bars), the inversion result of magnetic field (the red dashed line), the fitting result to the extrapolated field using a bipolar model (the black dashed line). Panel d: measured amplitude multiplied by a scaling coefficient of 0.027 pixel−1 (the blue diamonds with error bars), and the inverted fundamental mode with L/πH = 1.50 and L/πD = 0.61 (the green dotted line).
Current usage metrics show cumulative count of Article Views (full-text article views including HTML views, PDF and ePub downloads, according to the available data) and Abstracts Views on Vision4Press platform.
Data correspond to usage on the plateform after 2015. The current usage metrics is available 48-96 hours after online publication and is updated daily on week days.
Initial download of the metrics may take a while.