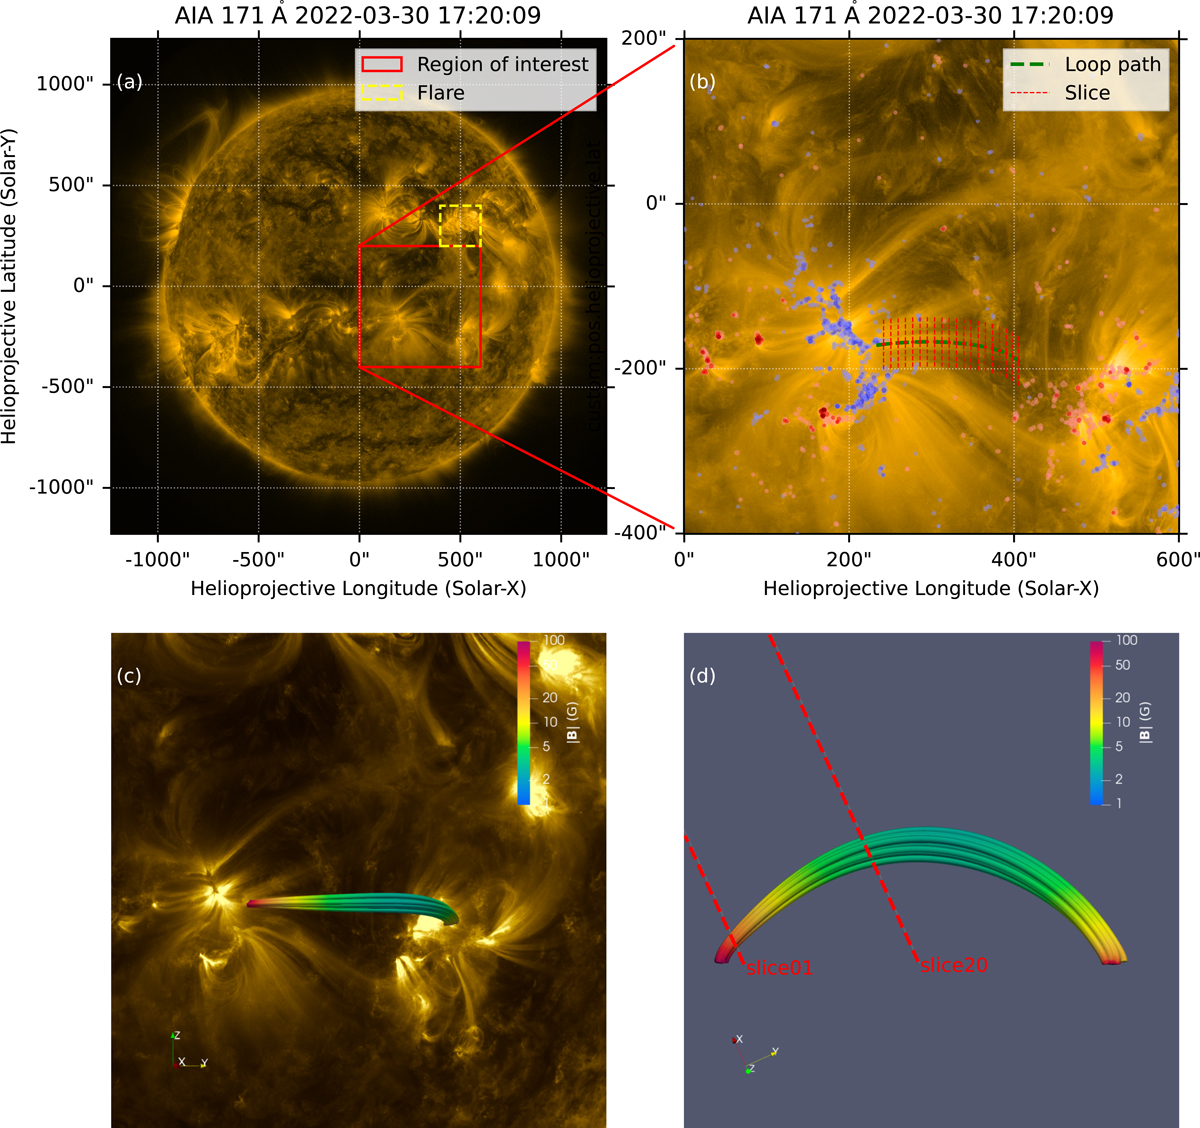
Fig. 5.
Download original image
SDO/AIA 171 Å image and the extrapolated magnetic field. Panel a: full-disk image in 171 Å at 17:20 UT. Panel b: subregion of the SDO/AIA image overlaid with the line-of-sight magnetic field observed by SDO/HMI. The loop path is denoted by the green dashed line and the selected slices are marked by the red dashed lines. Panel c: potential field model overlaid on the AIA 171 Å image. Panel d: side view of the reconstructed loop. The red dashed lines show the slice position on the loop and the direction of the line of sight.
Current usage metrics show cumulative count of Article Views (full-text article views including HTML views, PDF and ePub downloads, according to the available data) and Abstracts Views on Vision4Press platform.
Data correspond to usage on the plateform after 2015. The current usage metrics is available 48-96 hours after online publication and is updated daily on week days.
Initial download of the metrics may take a while.