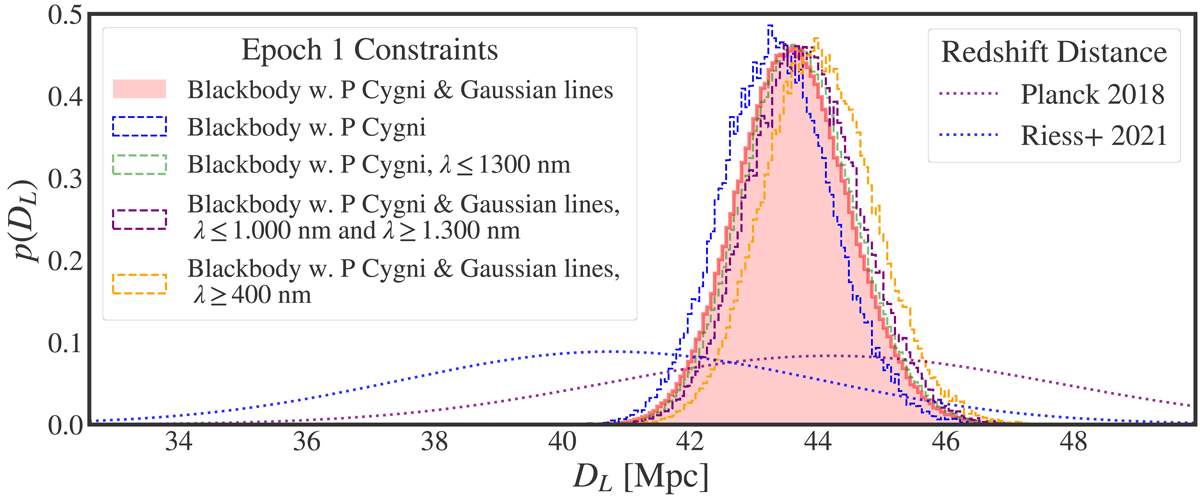
Fig. 5.
Download original image
Posterior probability distributions of luminosity distances for the first epoch spectrum with and without modelling of different emission features. This shows the size of effects related to the choice of how the continuum and lines are modelled. The canonical model (red) is a blackbody continuum with Sr+ elementary supernova P Cygni lines and Gaussian emission lines at 1.5 μm and 2 μm. The green histogram shows the effect of limiting the analysis to wavelengths below 1300 nm and using only a blackbody continuum with Sr+ P Cygni, which avoids the need to include the 1.5 μm and 2 μm lines in the model. Very similar distances are found fitting the full dataset with only a blackbody and the Sr+ P Cygni lines (blue) or only fitting the absorption wavelengths of the P Cygni (purple) (i.e., excluding the P Cygni emission wavelengths, 1 μm < λ < 1.3 μm, from the fit). Lastly, the distance is robust to the lower wavelength cutoff as seen by fitting the canonical model to wavelengths λ > 330 nm (red) or λ > 400 nm (yellow). The fitting result is therefore very robust to the details of how the fit is performed and what data are included. Distances inferred from the cosmological redshift are also plotted for H0 = 67.36 ± 0.54 (Planck Collaboration VI 2020) (dotted purple) and H0 = 73.03 ± 1.04 (Riess et al. 2022) (dotted blue).
Current usage metrics show cumulative count of Article Views (full-text article views including HTML views, PDF and ePub downloads, according to the available data) and Abstracts Views on Vision4Press platform.
Data correspond to usage on the plateform after 2015. The current usage metrics is available 48-96 hours after online publication and is updated daily on week days.
Initial download of the metrics may take a while.